Samsung 2007 Annual Report Download - page 76
Download and view the complete annual report
Please find page 76 of the 2007 Samsung annual report below. You can navigate through the pages in the report by either clicking on the pages listed below, or by using the keyword search tool below to find specific information within the annual report.-
 1
1 -
2
-
3
-
4
-
5
-
6
-
7
-
8
-
9
-
10
-
11
-
12
-
13
-
14
-
15
-
16
-
17
-
18
-
19
-
20
-
21
-
22
-
23
-
24
-
25
-
26
-
27
-
28
-
29
-
30
-
31
-
32
-
33
-
34
-
35
-
36
-
37
-
38
-
39
-
40
-
41
-
42
-
43
-
44
-
45
-
46
-
47
-
48
-
49
-
50
-
51
-
52
-
53
-
54
-
55
-
56
-
57
-
58
-
59
-
60
-
61
-
62
-
63
-
64
-
65
-
 66
66 -
 67
67 -
 68
68 -
 69
69 -
 70
70 -
 71
71 -
 72
72 -
 73
73 -
 74
74 -
 75
75 -
 76
76 -
 77
77 -
 78
78 -
 79
79 -
 80
80 -
 81
81 -
 82
82 -
 83
83 -
 84
84 -
 85
85 -
 86
86 -
87
-
88
-
89
-
90
-
91
-
92
-
93
-
94
-
95
-
96
-
97
-
98
-
99
-
100
-
101
-
102
-
103
-
104
-
105
-
106
-
107
-
108
-
109
-
110
-
111
-
112
-
113
-
114
-
115
-
116
-
117
-
118
-
119
-
120
-
121
-
122
-
123
-
124
-
125
-
126
-
127
-
128
-
129
-
130
-
131
-
132
-
133
-
134
-
135
-
136
-
137
-
138
-
139
-
140
 |
 |
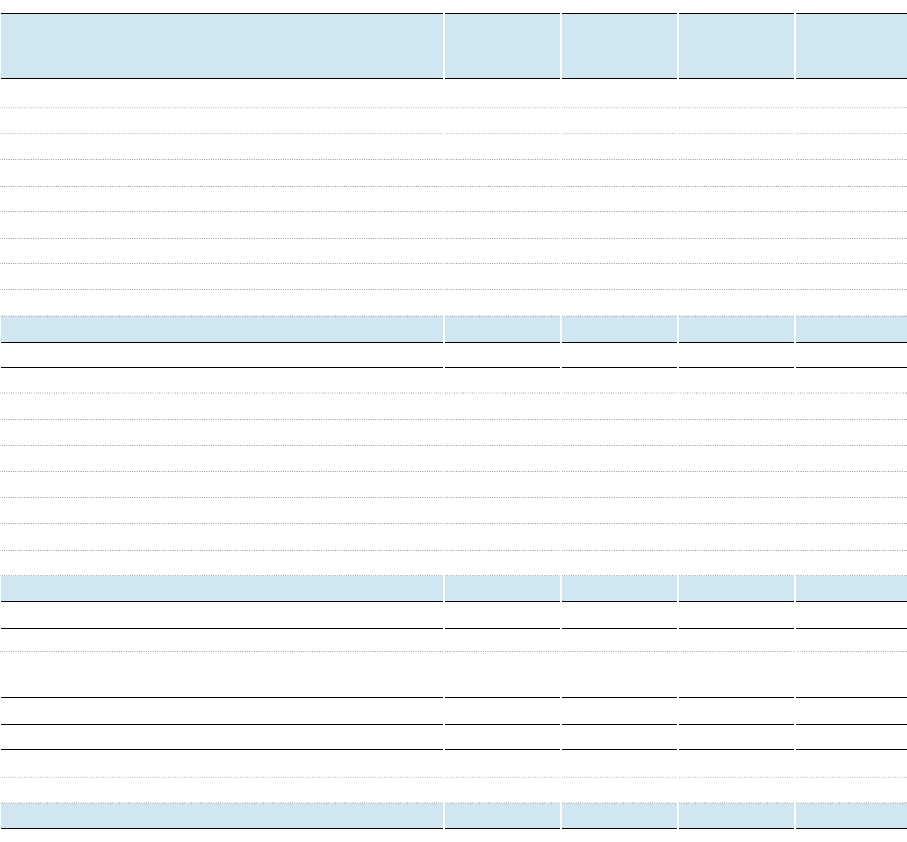
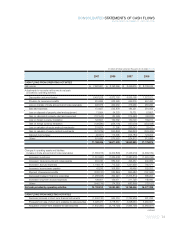
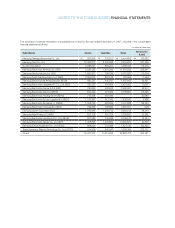
CONSOLIDATED STATEMENTS OF CASH FLOWS
YEARS ENDED DECEMBER 31, 2007 AND 2006
(In millions of Korean won and in thousands of U.S. dollars (Note 3))
Decrease (increase) in other accounts and notes receivable
₩
220,787
₩
(93,219) $ 235,381 $ (99,381)
Proceeds from disposal of property, plant and equipment 491,701 344,797 524,201 367,587
Acquisition of property, plant and equipment (12,251,537) (11,738,291) (13,061,340) (12,514,170)
Proceeds from sale of long-term available-for-sale securities 82,198 22,625 87,631 24,120
Proceeds from sale of long-term held-to-maturity securities 49,124 75,211 52,371 80,182
Proceeds from sale of equity-method investments 184,472 23,073 196,665 24,598
Acquisition of long-term available-for-sale securities (20,758) (34,226) (22,130) (36,488)
Acquisition of equity-method investments (127,080) (142,904) (135,480) (152,350)
Others (170,953) (118,948) (182,253) (126,808)
Net cash used in investing activities (12,002,059) (11,097,707) (12,795,372) (11,831,244)
CASH FLOWS FROM FINANCING ACTIVITIES
Net proceeds from (repayment of) short-term borrowings 798,134 (545,201) 850,889 (581,238)
Proceeds from long-term debts 2,527,696 3,086,201 2,694,772 3,290,193
Repayment of long-term debts (191,644) (277,859) (204,311) (296,225)
Repayment of current maturities of long-term debts (2,767,259) (4,183,020) (2,950,170) (4,459,510)
Payment of dividends (819,110) (831,789) (873,252) (886,769)
Acquisition of treasury stock (1,825,395) (1,812,879) (1,946,050) (1,932,707)
Others 677,766 675,317 722,565 719,955
Net cash used in financing activities (1,599,812) (3,889,230) (1,705,557) (4,146,301)
Effect of exchange rate changes on cash and cash equivalents 419,006 30,125 446,701 32,116
Net increase in cash and cash equivalents from
changes in consolidated subsidiaries 2,016 15,423 2,150 16,443
Net increase in cash and cash equivalents 1,609,963 139,210 1,716,378 148,412
CASH AND CASH EQUIVALENTS
Beginning of year 4,222,027 4,082,817 4,501,095 4,352,683
End of the year
₩
5,831,990
₩
4,222,027 $ 6,217,473 $ 4,501,095
The accompanying notes are an integral part of these consolidated financial statements.
2007 2006 2007 2006