Samsung 2007 Annual Report Download - page 129
Download and view the complete annual report
Please find page 129 of the 2007 Samsung annual report below. You can navigate through the pages in the report by either clicking on the pages listed below, or by using the keyword search tool below to find specific information within the annual report.-
 1
1 -
2
-
3
-
4
-
5
-
6
-
7
-
8
-
9
-
10
-
11
-
12
-
13
-
14
-
15
-
16
-
17
-
18
-
19
-
20
-
21
-
22
-
23
-
24
-
25
-
26
-
27
-
28
-
29
-
30
-
31
-
32
-
33
-
34
-
35
-
36
-
37
-
38
-
39
-
40
-
41
-
42
-
43
-
44
-
45
-
46
-
47
-
48
-
49
-
50
-
51
-
52
-
53
-
54
-
55
-
56
-
57
-
58
-
59
-
60
-
61
-
62
-
63
-
64
-
65
-
66
-
67
-
68
-
69
-
70
-
71
-
72
-
73
-
74
-
75
-
76
-
77
-
78
-
79
-
80
-
81
-
82
-
83
-
84
-
85
-
86
-
87
-
88
-
89
-
90
-
91
-
92
-
93
-
94
-
95
-
96
-
97
-
98
-
99
-
100
-
101
-
102
-
103
-
104
-
105
-
106
-
107
-
108
-
109
-
110
-
111
-
112
-
113
-
114
-
115
-
116
-
117
-
118
-
 119
119 -
 120
120 -
 121
121 -
 122
122 -
 123
123 -
 124
124 -
 125
125 -
 126
126 -
 127
127 -
 128
128 -
 129
129 -
 130
130 -
 131
131 -
 132
132 -
 133
133 -
 134
134 -
 135
135 -
 136
136 -
 137
137 -
 138
138 -
 139
139 -
140
 |
 |

127
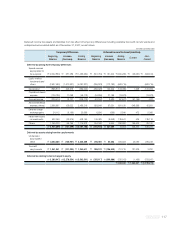
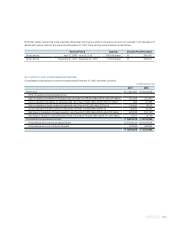
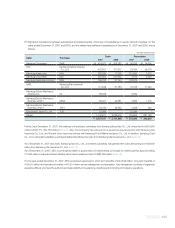
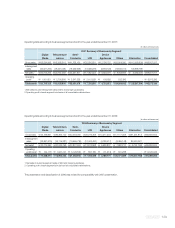
Monetary assets and liabilities of overseas subsidiaries after eliminating intercompany ransactions are translated at the foreign
exchange rate in effect as of the balance sheet date.
Foreign currency translation gains and losses for the year ended December 31, 2007, amounted to ₩128,577 million and ₩122,597
million, respectively.
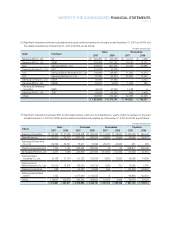
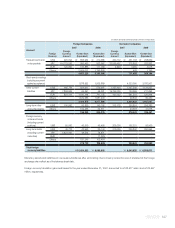
Foreign Companies Domestic Companies
2007 2006 2007 2006
Foreign Foreign
Foreign Currency Korean Won Korean Won Currency Korean Won Korean Won
Currency Amount (Equivalent) (Equivalent) Amount (Equivalent) (Equivalent)
(In millions of Korean won and foreign currencies in thousands)
Trade accounts and US$ 920,094
₩
863,232
₩
410,685 460,172
₩
431,733
₩
298,669
notes payable JPY 114,779,592 956,493 923,962 33,096,452 275,803 262,852
EUR 120,820 166,883 111,063 2,526 3,489 4,918
Others 2,664,612 1,749,856 468 1,745
4,651,220 3,195,566 711,493 568,184
Short-term borrowings
(including document
against acceptance)
1,878,552 1,935,889 4,323,095 3,760,967
Other current US$ 665,776 624,631 579,997 1,457,630 1,367,549 1,133,957
liabilities JPY 7,858,906 65,491 55,031 19,764,000 164,699 211,692
EUR 854,414 1,180,168 761,135 421,022 581,541 520,968
Others 1,532,585 1,081,403 90,843 80,430
3,402,875 2,477,566 2,204,632 1,947,047
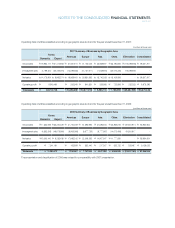
Long-term other US$ 100,000 93,820 140,765 313,178 293,824 295,383
accounts payable Others 102,433 64,511 24,618 41,078
196,253 205,276 318,442 336,461
Foreign currency
notes and bonds
(including current
portions) US$ 50,000 46,910 46,480 205,000 192,331 92,960
Long-term debts US$ 45,772 42,943 29,144 310,000 290,842 250,992
(including current JPY 5,824,000 48,533 78,871 - - -
maturities) EUR - - 17,329 - - -
Others 187,246 103,484 - -
278,722 228,828 290,842 250,992
Total foreign
currency liabilities
₩
10,454,532
₩
8,089,605
₩
8,040,835
₩
6,956,611
Account