Samsung 2007 Annual Report Download - page 130
Download and view the complete annual report
Please find page 130 of the 2007 Samsung annual report below. You can navigate through the pages in the report by either clicking on the pages listed below, or by using the keyword search tool below to find specific information within the annual report.-
 1
1 -
2
-
3
-
4
-
5
-
6
-
7
-
8
-
9
-
10
-
11
-
12
-
13
-
14
-
15
-
16
-
17
-
18
-
19
-
20
-
21
-
22
-
23
-
24
-
25
-
26
-
27
-
28
-
29
-
30
-
31
-
32
-
33
-
34
-
35
-
36
-
37
-
38
-
39
-
40
-
41
-
42
-
43
-
44
-
45
-
46
-
47
-
48
-
49
-
50
-
51
-
52
-
53
-
54
-
55
-
56
-
57
-
58
-
59
-
60
-
61
-
62
-
63
-
64
-
65
-
66
-
67
-
68
-
69
-
70
-
71
-
72
-
73
-
74
-
75
-
76
-
77
-
78
-
79
-
80
-
81
-
82
-
83
-
84
-
85
-
86
-
87
-
88
-
89
-
90
-
91
-
92
-
93
-
94
-
95
-
96
-
97
-
98
-
99
-
100
-
101
-
102
-
103
-
104
-
105
-
106
-
107
-
108
-
109
-
110
-
111
-
112
-
113
-
114
-
115
-
116
-
117
-
118
-
119
-
 120
120 -
 121
121 -
 122
122 -
 123
123 -
 124
124 -
 125
125 -
 126
126 -
 127
127 -
 128
128 -
 129
129 -
 130
130 -
 131
131 -
 132
132 -
 133
133 -
 134
134 -
 135
135 -
 136
136 -
 137
137 -
 138
138 -
 139
139 -
 140
140
 |
 |
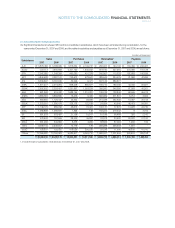
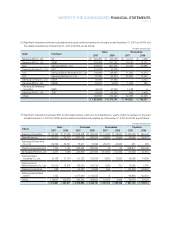
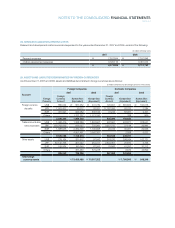
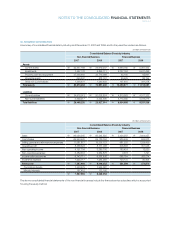
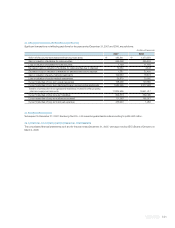
NOTES TO THE CONSOLIDATED FINANCIAL STATEMENTS
continued
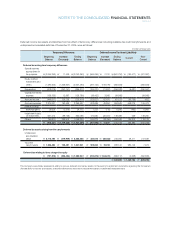
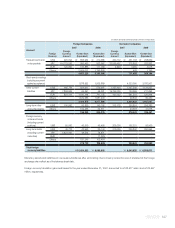
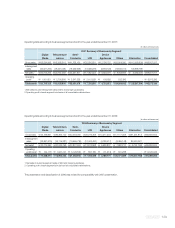
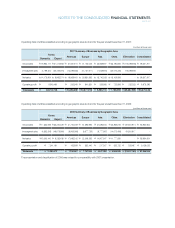
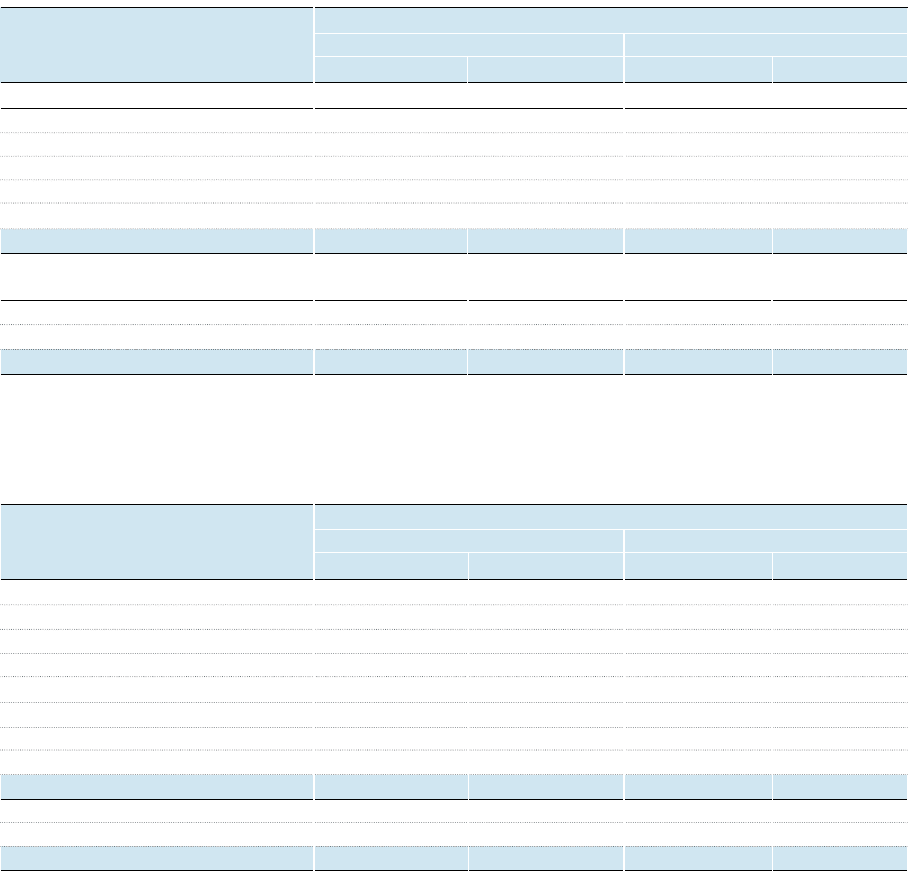
30. SEGMENT INFORMATION
A summary of consolidated financial data by industry as of December 31, 2007 and 2006, and for the years then ended, are follows:
Assets
Current assets
₩
35,437,169
₩
29,619,547
₩
6,464,785
₩
5,367,432
Investments 7,497,133 5,846,111 5,727,153 5,241,496
Property, plant and equipment 37,336,483 33,719,089 45,100 65,691
Intangible assets 645,247 572,191 59,429 86,194
Other non-current assets 1,394,431 1,240,492 197,410 391,278
Total assets
₩
82,310,463
₩
70,997,430
₩
12,493,877
₩
11,152,091
Liabilities
Current liabilities
₩
24,976,013
₩
20,603,624
₩
4,819,963
₩
4,917,322
Non-current liabilities 3,492,217 3,323,390 4,115,035 4,414,216
Total liabilities
₩
28,468,230
₩
23,927,014
₩
8,934,998
₩
9,331,538
Consolidated Balance Sheets by Industry
Non-financial Business Financial Business
2007 2006 2007 2006
(In millions of Korean won)
The above consolidated financial statements of the non-financial business include the financial service subsidiary which is accounted
for using the equity method.
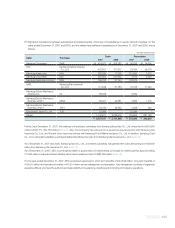
Sales
₩
96,090,565
₩
83,243,925
₩
2,426,287
₩
2,604,957
Cost of sales 69,940,425 59,130,794 939,409 924,973
Selling, general and administrative expenses 17,681,817 15,336,123 981,220 1,328,439
Operating profit 8,468,323 8,777,008 505,658 351,545
Non-operating income 4,157,704 3,380,706 183,424 12,520
Non-operating expenses 3,482,316 2,564,878 3,318 1,791
Income before income tax 9,143,711 9,592,836 685,764 362,274
Income tax expense 1,555,717 1,543,583 154,175 90,404
Net income
₩
7,587,994
₩
8,049,253
₩
531,589
₩
271,870
Controlling interests 7,420,579 7,926,087
Minority interests 167,415 123,166
₩
7,587,994
₩
8,049,253
Consolidated Balance Sheets by Industry
Non-financial Business Financial Business
2007 2006 2007 2006
(In millions of Korean won)