Samsung 2007 Annual Report Download - page 124
Download and view the complete annual report
Please find page 124 of the 2007 Samsung annual report below. You can navigate through the pages in the report by either clicking on the pages listed below, or by using the keyword search tool below to find specific information within the annual report.-
 1
1 -
2
-
3
-
4
-
5
-
6
-
7
-
8
-
9
-
10
-
11
-
12
-
13
-
14
-
15
-
16
-
17
-
18
-
19
-
20
-
21
-
22
-
23
-
24
-
25
-
26
-
27
-
28
-
29
-
30
-
31
-
32
-
33
-
34
-
35
-
36
-
37
-
38
-
39
-
40
-
41
-
42
-
43
-
44
-
45
-
46
-
47
-
48
-
49
-
50
-
51
-
52
-
53
-
54
-
55
-
56
-
57
-
58
-
59
-
60
-
61
-
62
-
63
-
64
-
65
-
66
-
67
-
68
-
69
-
70
-
71
-
72
-
73
-
74
-
75
-
76
-
77
-
78
-
79
-
80
-
81
-
82
-
83
-
84
-
85
-
86
-
87
-
88
-
89
-
90
-
91
-
92
-
93
-
94
-
95
-
96
-
97
-
98
-
99
-
100
-
101
-
102
-
103
-
104
-
105
-
106
-
107
-
108
-
109
-
110
-
111
-
112
-
113
-
 114
114 -
 115
115 -
 116
116 -
 117
117 -
 118
118 -
 119
119 -
 120
120 -
 121
121 -
 122
122 -
 123
123 -
 124
124 -
 125
125 -
 126
126 -
 127
127 -
 128
128 -
 129
129 -
 130
130 -
 131
131 -
 132
132 -
 133
133 -
 134
134 -
135
-
136
-
137
-
138
-
139
-
140
 |
 |
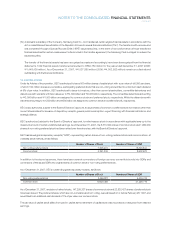
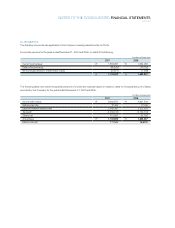
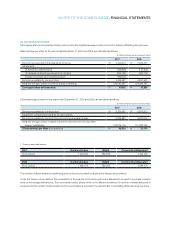
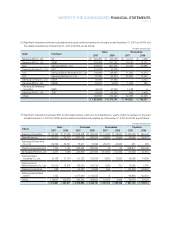
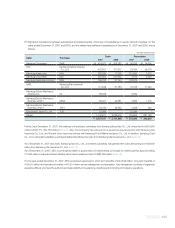
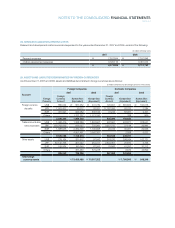
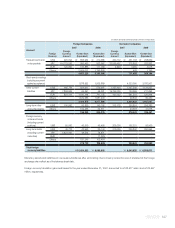
NOTES TO THE CONSOLIDATED FINANCIAL STATEMENTS
continued
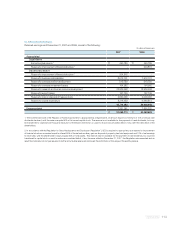
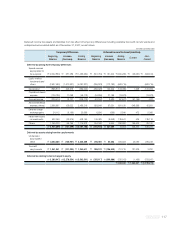
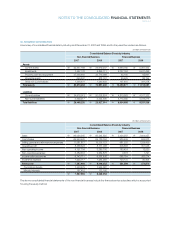
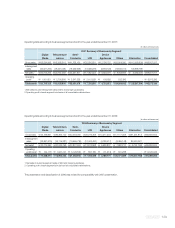
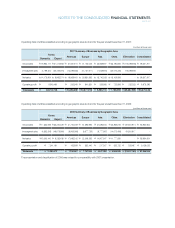
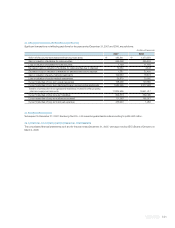
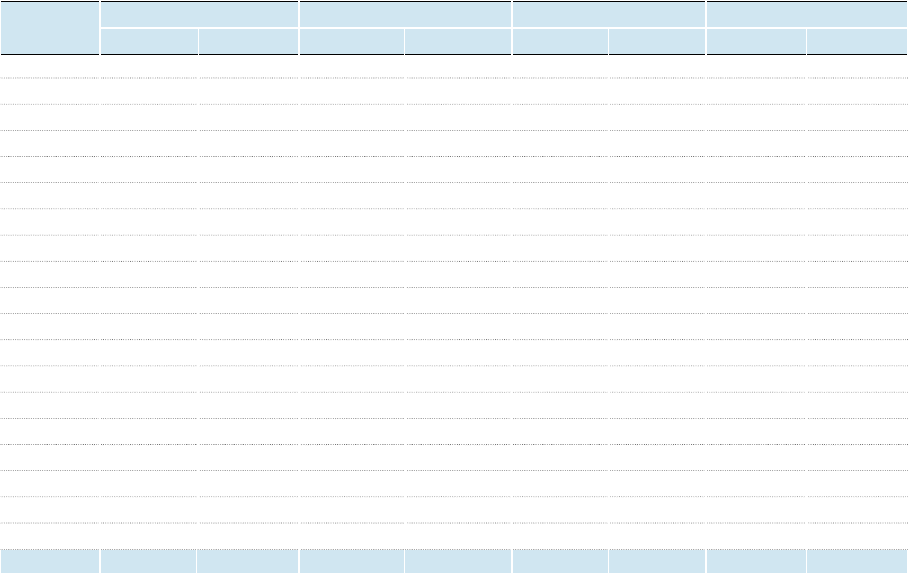
27. RELATED PARTY TRANSACTIONS
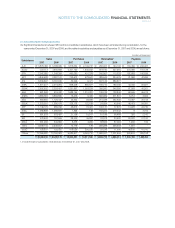
(A) Significant transactions between SEC and its consolidated subsidiaries, which have been eliminated during consolidation, for the
years ended December 31, 2007 and 2006, and the related receivables and payables as of December 31, 2007 and 2006, are as follows:
(In millions of Korean won)
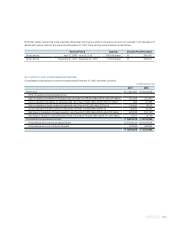
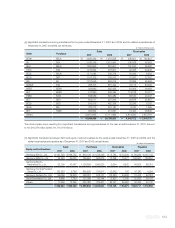
1. Include the sale of subsidiaries’ receivables as of December 31, 2007 and 2006.
SJC
₩
3,878,456
₩
3,798,069
₩
1,816,334
₩
2,100,737
₩
266,067
₩
194,106
₩
164,459
₩
244,467
SLCD 1,272,13 4 930,983 2,401,750 1,940,542 618,180 327,564 270,395 161,129
STA 2,042,880 1,248,304 490,280 401,378 240,957 110,333 182,683 166,839
SET 4,846,588 3,987,161 749,573 578,541 389,544 334,475 31,958 42,696
SSI 6,339,597 6,797,940 32,249 9,471 537,142 589,577 - -
SAPL 1,977,577 2,318,294 868,209 880,677 166,710 189,049 43,345 36,921
SEHK 2,602,602 2,293,407 1,251,867 1,053,224 305,260 246,390 67,928 40,261
SEA 681,968 619,432 1,588,155 1,310,381 136,749 138,846 58,545 65,619
SSEG 4,683,872 3,866,865 16,476 5,405 566,969 371,801 5,712 3,324
SEO 683,950 1,726,447 43,322 58,595 210,339 292,635 13,087 20,103
SEUK 1,275,001 1,386,474 128,178 122,189 24,554 40,646 46,473 54,091
SEF 1,149,175 989,792 26,613 31,421 100,131 77,575 14,228 24,730
SSEL 1,285,898 1,289,931 1,855 148 192,224 219,342 8 3,702
SII 697,578 678,497 21,106 15,517 81,189 66,468 320 2,010
SEI 478,643 797,545 38,400 45,937 33,078 30,600 26,220 41,100
SELS 361,466 340,656 8,378 3,260 68,825 87,094 1,466 184
TSTC 3,039,144 2,549,547 14,179 179 259,299 236,333 1,051 -
SESC 128,307 125,752 418,026 290,226 25,235 11,936 46,305 41,010
Others 12,055,982 10,750,083 5,689,401 5,063,732 1,586,341 1,301,644 926,603 935,168
₩
49,480,818
₩
46,495,179
₩
15,604,351
₩
13,911,560
₩
5,808,793
₩
4,866,414
₩
1,900,786
₩
1,883,354
Sales Purchases Receivables 1 Payables
Subsidiaries 2007 2006 2007 2006 2007 2006 2007 2006