Samsung 2007 Annual Report Download - page 75
Download and view the complete annual report
Please find page 75 of the 2007 Samsung annual report below. You can navigate through the pages in the report by either clicking on the pages listed below, or by using the keyword search tool below to find specific information within the annual report.-
 1
1 -
2
-
3
-
4
-
5
-
6
-
7
-
8
-
9
-
10
-
11
-
12
-
13
-
14
-
15
-
16
-
17
-
18
-
19
-
20
-
21
-
22
-
23
-
24
-
25
-
26
-
27
-
28
-
29
-
30
-
31
-
32
-
33
-
34
-
35
-
36
-
37
-
38
-
39
-
40
-
41
-
42
-
43
-
44
-
45
-
46
-
47
-
48
-
49
-
50
-
51
-
52
-
53
-
54
-
55
-
56
-
57
-
58
-
59
-
60
-
61
-
62
-
63
-
64
-
 65
65 -
 66
66 -
 67
67 -
 68
68 -
 69
69 -
 70
70 -
 71
71 -
 72
72 -
 73
73 -
 74
74 -
 75
75 -
 76
76 -
 77
77 -
 78
78 -
 79
79 -
 80
80 -
 81
81 -
 82
82 -
 83
83 -
 84
84 -
 85
85 -
86
-
87
-
88
-
89
-
90
-
91
-
92
-
93
-
94
-
95
-
96
-
97
-
98
-
99
-
100
-
101
-
102
-
103
-
104
-
105
-
106
-
107
-
108
-
109
-
110
-
111
-
112
-
113
-
114
-
115
-
116
-
117
-
118
-
119
-
120
-
121
-
122
-
123
-
124
-
125
-
126
-
127
-
128
-
129
-
130
-
131
-
132
-
133
-
134
-
135
-
136
-
137
-
138
-
139
-
140
 |
 |
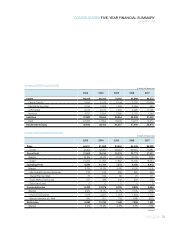
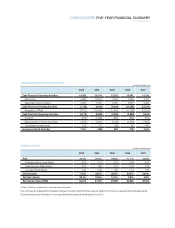
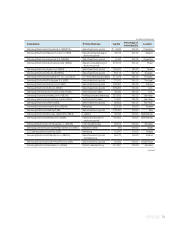
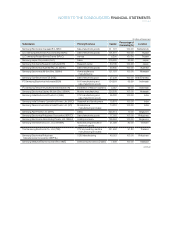
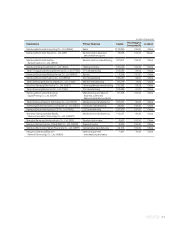
73
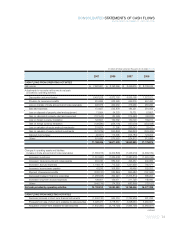
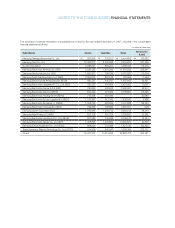
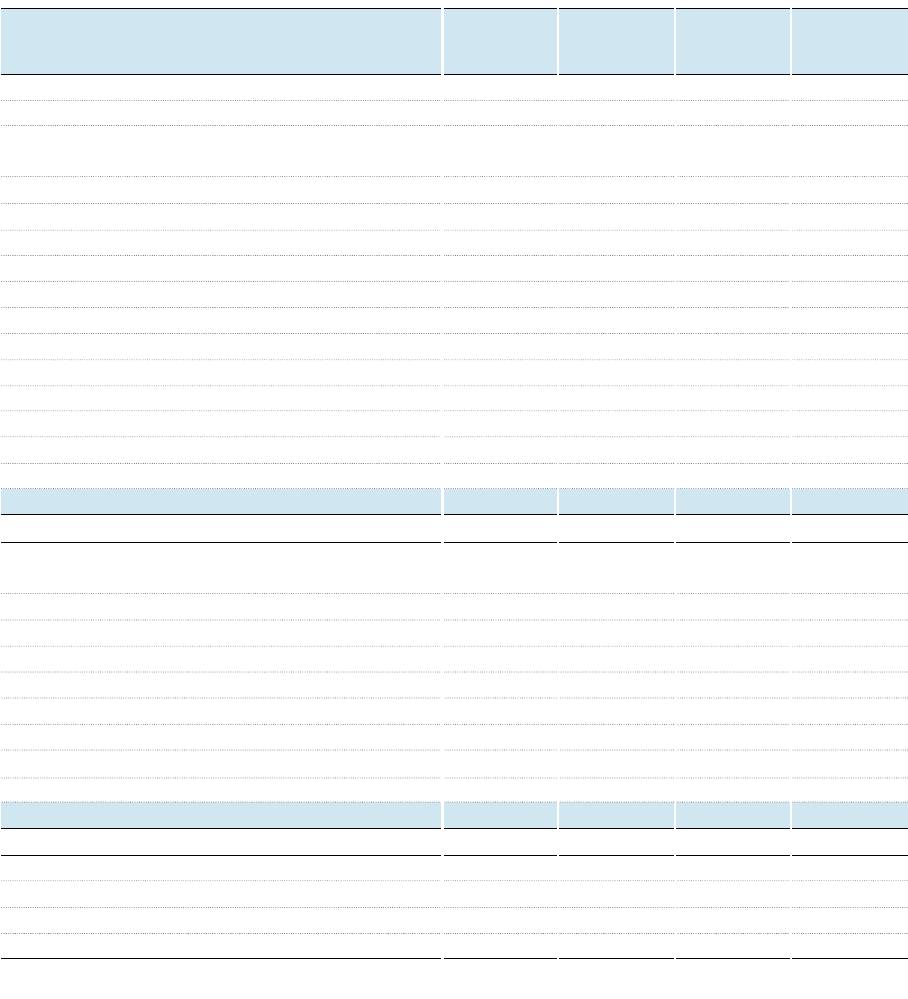
CONSOLIDATED STATEMENTS OF CASH FLOWS
YEARS ENDED DECEMBER 31, 2007 AND 2006
(In millions of Korean won and in thousands of U.S. dollars (Note 3))
continued
CASH FLOWS FROM OPERATING ACTIVITIES
Net income
₩
7,922,981
₩
8,193,659 $ 8,446,675 $ 8,735,244
Adjustments to reconcile net income to net cash
provided by operating activities
Depreciation and amortization 8,497,528 6,872,793 9,059,198 7,327,071
Provision for severance benefits 615,586 522,926 656,275 557,490
Loss on transfer of trade accounts and notes receivable 296,375 269,450 315,965 287,260
Bad debt expenses 172,827 545,878 184,251 581,959
Loss on disposal of property, plant and equipment 71,964 54,270 76,721 57,857
Gain on disposal of property, plant and equipment (107,542) (84,629) (114,650) (90,223)
Loss on foreign currency translation 122,597 159,382 130,700 169,917
Gain on foreign currency translation (128,580) (238,194) (137,079) (253,938)
Loss on valuation of equity-method investments 274,874 31,396 293,043 33,471
Gain on valuation of equity-method investments (372,239) (340,893) (396,843) (363,425)
Deferred income taxes (99,601) 115,565 (106,184) 123,204
Others 501,656 575,920 534,813 613,988
17,768,426 16,677,523 18,942,885 17,779,875
Changes in operating assets and liabilities
Increase in trade accounts and notes receivables (1,355,615) (2,409,893) (1,445,219) (2,569,182)
Increase in inventories (1,301,580) (1,336,430) (1,387,612) (1,424,765)
Increase in trade accounts and notes payable 464,720 882,643 495,437 940,984
Increase in accrued expenses 1,146,178 713,322 1,221,938 760,471
Increase in income taxes payable 43,576 308,838 46,456 329,252
Payment of severance benefits (338,137) (184,845) (360,487) (197,063)
Decrease(increase) in financing receivables (1,288,638) 364,223 (1,373,814) 388,297
Increase in long-term accrued expenses 198,601 139,471 211,728 148,690
Others (546,719) (74,253) (582,856) (79,161)
Net cash provided by operating activities 14,790,812 15,080,599 15,768,456 16,077,398
CASH FLOWS FROM INVESTING ACTIVITIES
Decrease (increase) in short-term financial instruments (1,646,130) 564,016 (1,754,936) 601,296
Proceeds from sale of short-term available-for-sale securities 3,028,477 3,718,317 3,228,654 3,964,091
Acquisition of short-term available-for-sale securities (1,842,360) (3,718,158) (1,964,136) (3,963,921)
2007 2006 2007 2006