Samsung 2007 Annual Report Download - page 134
Download and view the complete annual report
Please find page 134 of the 2007 Samsung annual report below. You can navigate through the pages in the report by either clicking on the pages listed below, or by using the keyword search tool below to find specific information within the annual report.-
 1
1 -
2
-
3
-
4
-
5
-
6
-
7
-
8
-
9
-
10
-
11
-
12
-
13
-
14
-
15
-
16
-
17
-
18
-
19
-
20
-
21
-
22
-
23
-
24
-
25
-
26
-
27
-
28
-
29
-
30
-
31
-
32
-
33
-
34
-
35
-
36
-
37
-
38
-
39
-
40
-
41
-
42
-
43
-
44
-
45
-
46
-
47
-
48
-
49
-
50
-
51
-
52
-
53
-
54
-
55
-
56
-
57
-
58
-
59
-
60
-
61
-
62
-
63
-
64
-
65
-
66
-
67
-
68
-
69
-
70
-
71
-
72
-
73
-
74
-
75
-
76
-
77
-
78
-
79
-
80
-
81
-
82
-
83
-
84
-
85
-
86
-
87
-
88
-
89
-
90
-
91
-
92
-
93
-
94
-
95
-
96
-
97
-
98
-
99
-
100
-
101
-
102
-
103
-
104
-
105
-
106
-
107
-
108
-
109
-
110
-
111
-
112
-
113
-
114
-
115
-
116
-
117
-
118
-
119
-
120
-
121
-
122
-
123
-
 124
124 -
 125
125 -
 126
126 -
 127
127 -
 128
128 -
 129
129 -
 130
130 -
 131
131 -
 132
132 -
 133
133 -
 134
134 -
 135
135 -
 136
136 -
 137
137 -
 138
138 -
 139
139 -
 140
140
 |
 |
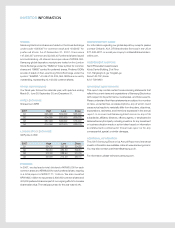
INVESTOR INFORMATION
SHARES
Samsung Electronics shares are traded on the Korea Exchange
under code “005930” for common stock and “005935” for
preferred stock. As of December 31, 2007, there were
147,299,337 common and 22,833,427 preferred shares issued
and outstanding. All shares have a par value of KRW5,000.
Samsung global depository receipts are traded on the London
Stock Exchange under the “SMSN LI” ticker symbol for common
shares and “SMSD” symbol for preferred shares. Preferred GDRs
are also traded on the Luxemburg Stock Exchange under the
symbol “SAMDR.” A total of 24,284,064 GDRs are currently
outstanding, representing 12,142,032 common shares.
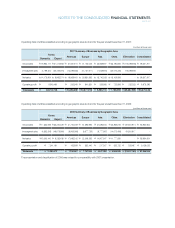
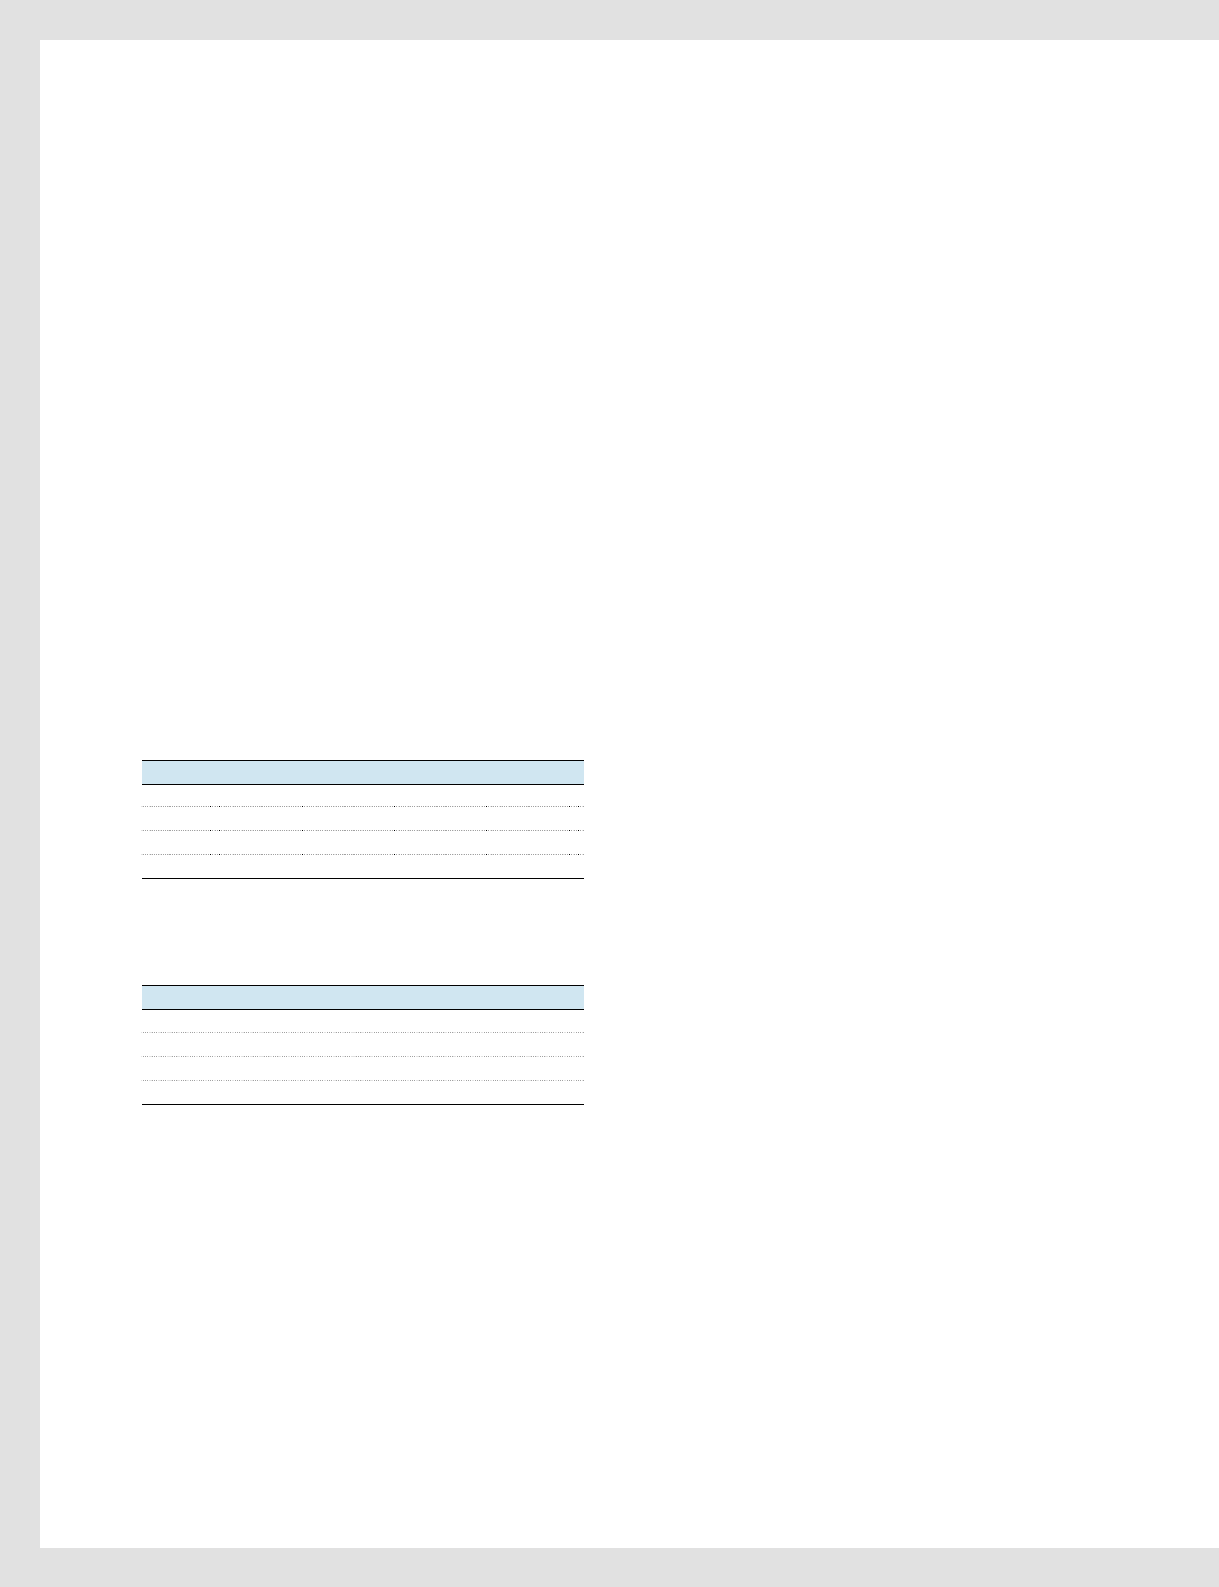
STOCK PERFORMANCE
Our fiscal year follows the calendar year, with quarters ending
March 31, June 30, September 30, and December 31.
KOREA EXCHANGE
Share price in KRW
LONDON STOCK EXCHANGE
GDR price in USD
DIVIDENDS
In 2007, we declared a total dividend of KRW8,000 for each
common share and KRW8,050 for each preferred share, resulting
in a total payout of KRW1171.1 billion. We also invested
KRW1825.4 billion to repurchase 2,800,000 common shares and
400,000 preferred shares as part of our ongoing efforts to increase
shareholder value. The total payout ratio for the year was 40.4%.
GDR DEPOSITORY AGENT
For information regarding our global depository receipts, please
contact Citibank, N.A. DR Shareholder Services in the US at
877-248-4237, or e-mail your inquiry to citibank@shareholders-
online.com.
INDEPENDENT AUDITORS
Samil PricewaterhouseCoopers
Kukje Center Building, 21st Floor
191, Hangangno 2-ga, Yongsan-gu
Seoul 140-702, Korea
82-2-709-0800
IMPORTANT INVESTOR NOTE
This report may contain certain forward-looking statements that
reflect the current views and expectations of Samsung Electronics
with respect to its performance, businesses, and future events.
Please understand that these statements are subject to a number
of risks, uncertainties, and assumptions, any of which could
cause actual results to materially differ from the plans, objectives,
expectations, estimates, and intentions expressed in this annual
report. In no event will Samsung Electronics nor any of its
subsidiaries, affiliates, directors, officers, agents, or employees be
liable before any third party, including investors, for any investment
or business decision made or action taken based on information
and statements contained in this annual report or for any
consequential, special, or similar damages.
ADDITIONAL INFORMATION
The 2007 Samsung Electronics Annual Report and the latest
investor information are available online at www.samsung.com/ir.
You may also contact us at [email protected].
For information, please visit www.samsung.com.
Q1 625,000 562,000 563,000
Q2 604,000 532,000 566,000
Q3 687,000 534,000 575,000
Q4 614,000 507,000 556,000
Q1 336.75 292.25 304.25
Q2 320.50 284.50 309.50
Q3 372.00 288.50 313.75
Q4 334.00 272.50 292.75
2007 High Low Close
2007 High Low Close