Samsung 2007 Annual Report Download - page 81
Download and view the complete annual report
Please find page 81 of the 2007 Samsung annual report below. You can navigate through the pages in the report by either clicking on the pages listed below, or by using the keyword search tool below to find specific information within the annual report.-
 1
1 -
2
-
3
-
4
-
5
-
6
-
7
-
8
-
9
-
10
-
11
-
12
-
13
-
14
-
15
-
16
-
17
-
18
-
19
-
20
-
21
-
22
-
23
-
24
-
25
-
26
-
27
-
28
-
29
-
30
-
31
-
32
-
33
-
34
-
35
-
36
-
37
-
38
-
39
-
40
-
41
-
42
-
43
-
44
-
45
-
46
-
47
-
48
-
49
-
50
-
51
-
52
-
53
-
54
-
55
-
56
-
57
-
58
-
59
-
60
-
61
-
62
-
63
-
64
-
65
-
66
-
67
-
68
-
69
-
70
-
 71
71 -
 72
72 -
 73
73 -
 74
74 -
 75
75 -
 76
76 -
 77
77 -
 78
78 -
 79
79 -
 80
80 -
 81
81 -
 82
82 -
 83
83 -
 84
84 -
 85
85 -
 86
86 -
 87
87 -
 88
88 -
 89
89 -
 90
90 -
 91
91 -
92
-
93
-
94
-
95
-
96
-
97
-
98
-
99
-
100
-
101
-
102
-
103
-
104
-
105
-
106
-
107
-
108
-
109
-
110
-
111
-
112
-
113
-
114
-
115
-
116
-
117
-
118
-
119
-
120
-
121
-
122
-
123
-
124
-
125
-
126
-
127
-
128
-
129
-
130
-
131
-
132
-
133
-
134
-
135
-
136
-
137
-
138
-
139
-
140
 |
 |
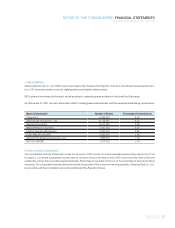
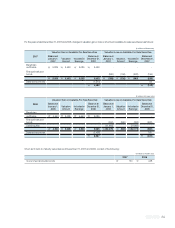
79
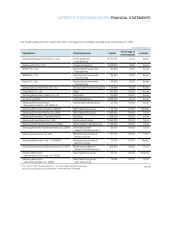
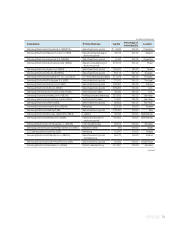
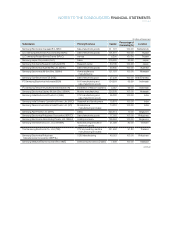
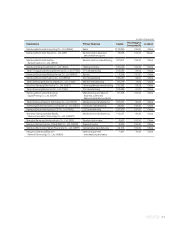
(In millions of Korean won)
continued
Percentage of
Subsidiaries Primary Business Capital Ownership(%) Location
Samsung Electronica Columbia S.A. (SAMCOL) Sale of electronic goods
₩
9,942 100.00 Columbia
Samsung Electronics Mexico S.A.de C.V. (SEM) Manufacturing and sale of 24,613 100.00 Mexico
electronic goods
Samsung Electronics Argentina S.A. (SEASA) Sale of electronic goods 5,443 100.00 Argentina
Samsung Electronica da Amazonia Ltda. (SEDA) Sale and manufacturing of 216,614 100.00 Brazil
electronic goods
Samsung Electronics Iberia, S.A. (SESA) Sale of electronic goods 109,970 100.00 Spain
Samsung Electronics Nordic AB (SENA) Sale of electronic goods 55,113 100.00 Sweden
Samsung Electronics Hungarian RT. Co., Ltd. (SEH) CTV manufacturing and sales 377,579 100.00 Hungary
Samsung Electronica Portuguesa S.A. (SEP) Sale of electronic goods 27,901 100.00 Portugal
Samsung Electronics France S.A.S. (SEF) Sale of electronic goods 160,897 100.00 France
Samsung Electronics (UK) Ltd. (SEUK) Sale of electronic goods 338,957 100.00 U.K.
Samsung Semiconductor Europe Limited (SSEL) Semiconductor sales 48,293 100.00 U.K.
Samsung Electronics Holding GmbH (SEHG) Holding company (financing) 251,055 100.00 Germany
Samsung Semiconductor Europe GmbH (SSEG) Semiconductor sales 12,607 100.00 Germany
Samsung Electronics GmbH (SEG) Sale of electronic goods 62,502 100.00 Germany
Samsung Electronics Austria GmbH (SEAG) Marketing 22,155 100.00 Austria
Samsung Electronics Italia SpA (SEI) Sale of electronic goods 102,363 100.00 Italy
Samsung Electronics Europe Logistics B.V. (SELS) Logistics 45,354 100.00 Netherlands
Samsung Electronics Benelux B.V. (SEBN) Distribution and sale of 190,903 100.00 Netherlands
electronic goods
Samsung Electronics LCD Slovakia s.r.o. (SELSK) LCD manufacturing 84,814 100.00 Slovakia
Samsung Semiconductor Israel R&D Center Ltd. (SIRC) Research center (87) 100.00 Israel
LLC Samsung Electronics Rus (SER) Marketing 12,547 100.00 Russia
Samsung Electronics Polska Sp.zo.o. (SEPOL) Sale of electronic goods 59,273 100.00 Poland
and telephone
Samsung Electronics South Africa (Pty) Ltd. (SSA) Sale of electronic goods 29,092 100.00 South Africa
Samsung Electronics Slovakia s.r.o. (SESK) Monitor manufacturing 421,867 100.00 Slovakia