Pizza Hut 2014 Annual Report Download - page 83
Download and view the complete annual report
Please find page 83 of the 2014 Pizza Hut annual report below. You can navigate through the pages in the report by either clicking on the pages listed below, or by using the keyword search tool below to find specific information within the annual report.-
 1
1 -
2
-
3
-
4
-
5
-
6
-
7
-
8
-
9
-
10
-
11
-
12
-
13
-
14
-
15
-
16
-
17
-
18
-
19
-
20
-
21
-
22
-
23
-
24
-
25
-
26
-
27
-
28
-
29
-
30
-
31
-
32
-
33
-
34
-
35
-
36
-
37
-
38
-
39
-
40
-
41
-
42
-
43
-
44
-
45
-
46
-
47
-
48
-
49
-
50
-
51
-
52
-
53
-
54
-
55
-
56
-
57
-
58
-
59
-
60
-
61
-
62
-
63
-
64
-
65
-
66
-
67
-
68
-
69
-
70
-
71
-
72
-
 73
73 -
 74
74 -
 75
75 -
 76
76 -
 77
77 -
 78
78 -
 79
79 -
 80
80 -
 81
81 -
 82
82 -
 83
83 -
 84
84 -
 85
85 -
 86
86 -
 87
87 -
 88
88 -
 89
89 -
 90
90 -
 91
91 -
 92
92 -
 93
93 -
94
-
95
-
96
-
97
-
98
-
99
-
100
-
101
-
102
-
103
-
104
-
105
-
106
-
107
-
108
-
109
-
110
-
111
-
112
-
113
-
114
-
115
-
116
-
117
-
118
-
119
-
120
-
121
-
122
-
123
-
124
-
125
-
126
-
127
-
128
-
129
-
130
-
131
-
132
-
133
-
134
-
135
-
136
-
137
-
138
-
139
-
140
-
141
-
142
-
143
-
144
-
145
-
146
-
147
-
148
-
149
-
150
-
151
-
152
-
153
-
154
-
155
-
156
-
157
-
158
-
159
-
160
-
161
-
162
-
163
-
164
-
165
-
166
-
167
-
168
-
169
-
170
-
171
-
172
-
173
-
174
-
175
-
176
 |
 |

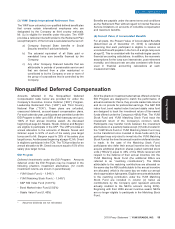
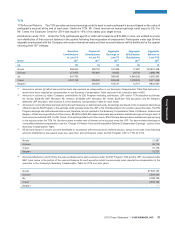
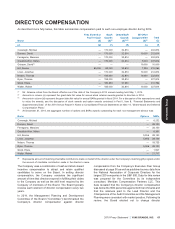
DIRECTOR COMPENSATION
As described more fully below, this table summarizes compensation paid to each non-employee director during 2014.
Cavanagh, Michael — 170,000 32,814 — 202,814
Dorman, David — 170,000 32,814 10,000 212,814
Ferragamo, Massimo — 170,000 32,814 — 202,814
Graddick-Weir, Mirian — 170,000 32,814 5,000 207,814
Grissom, David(1) — — — 10,000 10,000
Hill, Bonnie 85,000 85,000 32,814 7,250 210,064
Linen, Jonathan — 170,000 32,814 10,000 212,814
Nelson, Thomas — 190,000 32,814 10,000 232,814
Ryan, Thomas — 195,000 32,814 — 227,814
Stock, Elane — 180,833 31,930 — 212,764
Walter, Robert — 185,000 32,814 10,000 227,814
(1) Mr. Grissom retired from the Board effective as of the date of the Company’s 2014 annual meeting held May 1, 2014.
(2) Amounts in column (c) represent the grant date fair value for annual stock retainer awards granted to directors in 2014.
(3) Amounts in column (d) represent the grant date fair value for annual SARs granted in fiscal 2014. For a discussion of the assumptions used
to value the awards, see the discussion of stock awards and option awards contained in Part II, Item 8, ‘‘Financial Statements and
Supplementary Data’’ of the 2014 Annual Report in Notes to Consolidated Financial Statements at Note 14, ‘‘Share-based and Deferred
Compensation Plans.’’
(4) At December 31, 2014, the aggregate number of options and SARs awards outstanding for each non-management director was:
Cavanagh, Michael — 6,252
Dorman, David — 28,150
Ferragamo, Massimo — 28,150
Graddick-Weir, Mirian — 8,391
Hill, Bonnie 5,056 28,150
Linen, Jonathan 5,056 28,150
Nelson, Thomas — 19,733
Ryan, Thomas 5,056 28,150
Stock, Elane — 1,927
Walter, Robert — 21,717
(5) Represents amount of matching charitable contributions made on behalf of the director under the Company’s matching gift program and/or
the amount of charitable contribution made in the director’s name.
The Company uses a combination of cash and stock-based compensation from the Company’s Executive Peer Group
incentive compensation to attract and retain qualified discussed at page 36 as well as published survey data from
candidates to serve on the Board. In setting director the National Association of Corporate Directors for the
compensation, the Company considers the significant largest 200 companies in the S&P 500. Data for this review
amount of time that directors expend in fulfilling their duties was prepared for the Committee by its independent
to the Company as well as the skill level required by the consultant, Meridian Compensation Partners LLC. This
Company of members of the Board. The Board typically data revealed that the Company’s director compensation
reviews each element of director compensation every two was below the 50th percentile against both benchmarks and
years. that the retainers paid to the Lead Director and the
Chairpersons of the Audit Committee and the Management
In 2014, the Management Planning and Development Planning were consistent with market practice. Following its
Committee of the Board (‘‘Committee’’) benchmarked the review, the Board elected not to change director
Company’s director compensation against director
2015 Proxy Statement YUM! BRANDS, INC. 61
Fees Earned or Stock Option/SAR All Other
Paid in Cash Awards Awards Compensation Total
Name ($) ($)(2) ($)(3)(4) ($)(5) ($)
(a) (b) (c) (d) (e) (f)
Name Options SARs
Proxy Statement