Pizza Hut 2014 Annual Report Download - page 56
Download and view the complete annual report
Please find page 56 of the 2014 Pizza Hut annual report below. You can navigate through the pages in the report by either clicking on the pages listed below, or by using the keyword search tool below to find specific information within the annual report.-
 1
1 -
2
-
3
-
4
-
5
-
6
-
7
-
8
-
9
-
10
-
11
-
12
-
13
-
14
-
15
-
16
-
17
-
18
-
19
-
20
-
21
-
22
-
23
-
24
-
25
-
26
-
27
-
28
-
29
-
30
-
31
-
32
-
33
-
34
-
35
-
36
-
37
-
38
-
39
-
40
-
41
-
42
-
43
-
44
-
45
-
 46
46 -
 47
47 -
 48
48 -
 49
49 -
 50
50 -
 51
51 -
 52
52 -
 53
53 -
 54
54 -
 55
55 -
 56
56 -
 57
57 -
 58
58 -
 59
59 -
 60
60 -
 61
61 -
 62
62 -
 63
63 -
 64
64 -
 65
65 -
 66
66 -
67
-
68
-
69
-
70
-
71
-
72
-
73
-
74
-
75
-
76
-
77
-
78
-
79
-
80
-
81
-
82
-
83
-
84
-
85
-
86
-
87
-
88
-
89
-
90
-
91
-
92
-
93
-
94
-
95
-
96
-
97
-
98
-
99
-
100
-
101
-
102
-
103
-
104
-
105
-
106
-
107
-
108
-
109
-
110
-
111
-
112
-
113
-
114
-
115
-
116
-
117
-
118
-
119
-
120
-
121
-
122
-
123
-
124
-
125
-
126
-
127
-
128
-
129
-
130
-
131
-
132
-
133
-
134
-
135
-
136
-
137
-
138
-
139
-
140
-
141
-
142
-
143
-
144
-
145
-
146
-
147
-
148
-
149
-
150
-
151
-
152
-
153
-
154
-
155
-
156
-
157
-
158
-
159
-
160
-
161
-
162
-
163
-
164
-
165
-
166
-
167
-
168
-
169
-
170
-
171
-
172
-
173
-
174
-
175
-
176
 |
 |
13MAR201500030573
15MAR201511093851
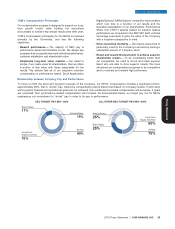
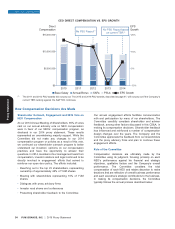
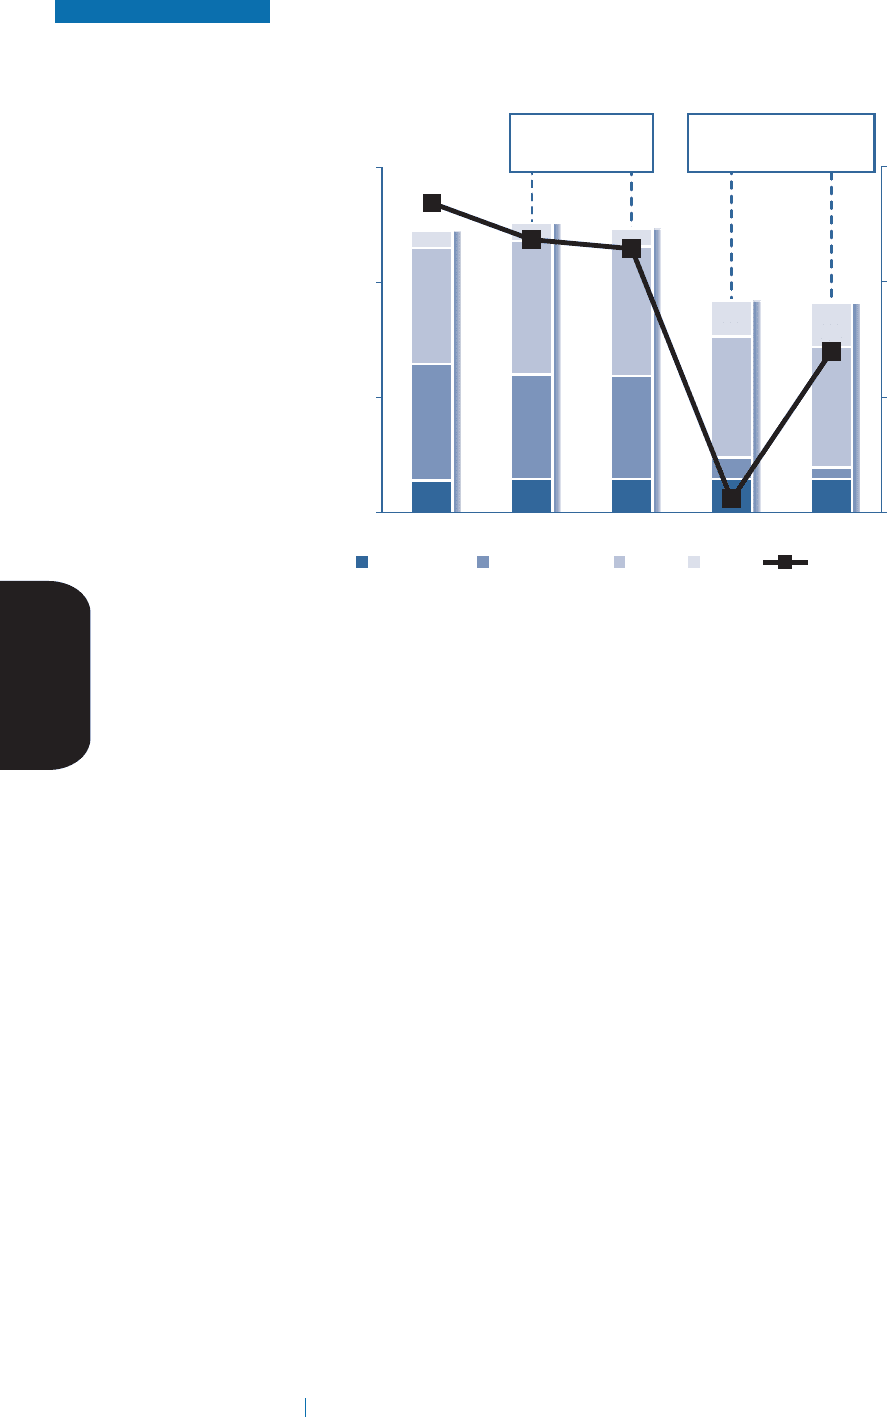
CEO DIRECT COMPENSATION VS. EPS GROWTH
$15,000,000
Direct
Compensation
$10,000,000
$5,000,000
$0
2013201220112010
EPS
Growth
-10%
0%
10%
20%
2014
Base Salary Annual Bonus SARs PSUs EPS Growth
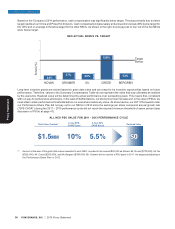
No PSU Payout(1) No PSU Payout based
on current TSR(1)
(1) The 2011 and 2012 PSU awards did not pay out. The 2013 and 2014 PSU awards, described at page 41, will not pay out if the Company’s
current TSR ranking against the S&P 500 continues.
How Compensation Decisions Are Made
.................................................................................................................................................................................................................................................................................................................................................................................
Shareholder Outreach, Engagement and 2014 Vote on Our annual engagement efforts facilitate communication
NEO Compensation with and participation by many of our shareholders. The
Committee carefully considers shareholder and advisor
At our 2014 Annual Meeting of Shareholders, 95% of votes feedback, among other factors discussed in this CD&A, in
cast on our annual advisory vote on NEO compensation making its compensation decisions. Shareholder feedback
were in favor of our NEOs’ compensation program, as has influenced and reinforced a number of compensation
disclosed in our 2014 proxy statement. These results design changes over the years. The Company and the
represented an overwhelming majority support. While the Committee appreciate the feedback from our shareholders
Committee did not make any changes to our 2014 and the proxy advisory firms and plan to continue these
compensation program or policies as a result of this vote, engagement efforts.
we continued our shareholder outreach program to better
understand our investors’ opinions on our compensation Role of the Committee
practices and have the opportunity to answer their
questions. In 2014, members of our management team from Compensation decisions are ultimately made by the
compensation, investor relations and legal continued to be Committee using its judgment, focusing primarily on each
directly involved in engagement efforts that served to NEO’s performance against his financial and strategic
reinforce our open door policy. The efforts included: objectives, qualitative factors and the Company’s overall
performance. The Committee considers the total
Reaching out to the top 25 shareholders, representing compensation of each NEO and retains discretion to make
ownership of approximately 46% of YUM shares decisions that are reflective of overall business performance
Meeting with shareholders representing 16% of YUM and each executive’s strategic contributions to the business.
shares In making its compensation decisions, the Committee
typically follows the annual process described below:
Dialogues with proxy advisory firms
Investor road shows and conferences
Presenting shareholder feedback to the Committee
34 YUM! BRANDS, INC. 2015 Proxy Statement
•
•
•
•
•
EXECUTIVE COMPENSATION
Proxy Statement