Pizza Hut 2014 Annual Report Download - page 160
Download and view the complete annual report
Please find page 160 of the 2014 Pizza Hut annual report below. You can navigate through the pages in the report by either clicking on the pages listed below, or by using the keyword search tool below to find specific information within the annual report.-
 1
1 -
2
-
3
-
4
-
5
-
6
-
7
-
8
-
9
-
10
-
11
-
12
-
13
-
14
-
15
-
16
-
17
-
18
-
19
-
20
-
21
-
22
-
23
-
24
-
25
-
26
-
27
-
28
-
29
-
30
-
31
-
32
-
33
-
34
-
35
-
36
-
37
-
38
-
39
-
40
-
41
-
42
-
43
-
44
-
45
-
46
-
47
-
48
-
49
-
50
-
51
-
52
-
53
-
54
-
55
-
56
-
57
-
58
-
59
-
60
-
61
-
62
-
63
-
64
-
65
-
66
-
67
-
68
-
69
-
70
-
71
-
72
-
73
-
74
-
75
-
76
-
77
-
78
-
79
-
80
-
81
-
82
-
83
-
84
-
85
-
86
-
87
-
88
-
89
-
90
-
91
-
92
-
93
-
94
-
95
-
96
-
97
-
98
-
99
-
100
-
101
-
102
-
103
-
104
-
105
-
106
-
107
-
108
-
109
-
110
-
111
-
112
-
113
-
114
-
115
-
116
-
117
-
118
-
119
-
120
-
121
-
122
-
123
-
124
-
125
-
126
-
127
-
128
-
129
-
130
-
131
-
132
-
133
-
134
-
135
-
136
-
137
-
138
-
139
-
140
-
141
-
142
-
143
-
144
-
145
-
146
-
147
-
148
-
149
-
 150
150 -
 151
151 -
 152
152 -
 153
153 -
 154
154 -
 155
155 -
 156
156 -
 157
157 -
 158
158 -
 159
159 -
 160
160 -
 161
161 -
 162
162 -
 163
163 -
 164
164 -
 165
165 -
 166
166 -
 167
167 -
 168
168 -
 169
169 -
 170
170 -
171
-
172
-
173
-
174
-
175
-
176
 |
 |

13MAR201517272138
PART II
ITEM 8 Financial Statements and Supplementary Data
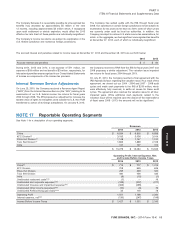
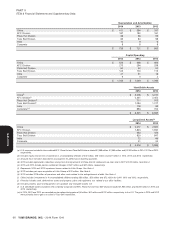
Depreciation and Amortization
2014 2013 2012
China $ 411 $ 394 $ 337
KFC Division 187 190 161
Pizza Hut Division 39 36 55
Taco Bell Division 83 84 98
India 10 9 6
Corporate 988
$ 739 $ 721 $ 665
Capital Spending
2014 2013 2012
China $ 525 $ 568 $ 655
KFC Division 273 294 259
Pizza Hut Division 62 52 52
Taco Bell Division 143 100 113
India 21 31 18
Corporate 942
$ 1,033 $ 1,049 $ 1,099
Identifiable Assets
2014 2013
China(i) $ 3,208 $ 3,720
KFC Division(l) 2,331 2,452
Pizza Hut Division(l) 711 703
Taco Bell Division(l) 1,084 1,017
India 118 99
Corporate(j)(l) 893 704
$ 8,345 $ 8,695
Long-Lived Assets(k)
2014 2013
China $ 2,217 $ 2,667
KFC Division 1,823 1,930
Pizza Hut Division 433 424
Taco Bell Division 920 847
India 72 66
Corporate 51 52
$ 5,516 $ 5,986
(a) U.S. revenues included in the combined KFC, Pizza Hut and Taco Bell Divisions totaled $2,959 million, $2,953 million and $3,352 million in 2014, 2013 and 2012,
respectively.
(b) Includes equity income from investments in unconsolidated affiliates of $30 million, $26 million and $47 million in 2014, 2013 and 2012, respectively.
(c) Amounts have not been allocated to any segment for performance reporting purposes.
(d) 2012 includes depreciation reductions arising from the impairments of Pizza Hut UK restaurants we later sold in 2012 of $13 million. See Note 4.
(e) 2013 and 2012 include pension settlement charges of $22 million and $87 million, respectively.
(f) Represents 2014 and 2013 impairment losses related to Little Sheep. See Note 4.
(g) 2012 includes gain upon acquisition of Little Sheep of $74 million. See Note 4.
(h) 2013 includes $118 million of premiums and other costs related to the extinguishment of debt. See Note 4.
(i) China includes investments in 4 unconsolidated affiliates totaling $52 million, $53 million and $72 million for 2014, 2013 and 2012, respectively.
(j) Primarily includes cash, deferred tax assets and property, plant and equipment, net, related to our office facilities.
(k) Includes property, plant and equipment, net, goodwill, and intangible assets, net.
(l) U.S. identifiable assets included in the combined Corporate and KFC, Pizza Hut and Taco Bell Divisions totaled $1,952 million and $2,061 million in 2014 and
2013, respectively.
(m) In 2014, 2013 and 2012, we recorded pre-tax refranchising gains of $6 million, $91 million and $122 million, respectively, in the U.S. The gains in 2013 and 2012
were primarily due to gains on sales of Taco Bell restaurants.
66 YUM! BRANDS, INC. - 2014 Form 10-K
Form 10-K