Pizza Hut 2014 Annual Report Download - page 155
Download and view the complete annual report
Please find page 155 of the 2014 Pizza Hut annual report below. You can navigate through the pages in the report by either clicking on the pages listed below, or by using the keyword search tool below to find specific information within the annual report.-
 1
1 -
2
-
3
-
4
-
5
-
6
-
7
-
8
-
9
-
10
-
11
-
12
-
13
-
14
-
15
-
16
-
17
-
18
-
19
-
20
-
21
-
22
-
23
-
24
-
25
-
26
-
27
-
28
-
29
-
30
-
31
-
32
-
33
-
34
-
35
-
36
-
37
-
38
-
39
-
40
-
41
-
42
-
43
-
44
-
45
-
46
-
47
-
48
-
49
-
50
-
51
-
52
-
53
-
54
-
55
-
56
-
57
-
58
-
59
-
60
-
61
-
62
-
63
-
64
-
65
-
66
-
67
-
68
-
69
-
70
-
71
-
72
-
73
-
74
-
75
-
76
-
77
-
78
-
79
-
80
-
81
-
82
-
83
-
84
-
85
-
86
-
87
-
88
-
89
-
90
-
91
-
92
-
93
-
94
-
95
-
96
-
97
-
98
-
99
-
100
-
101
-
102
-
103
-
104
-
105
-
106
-
107
-
108
-
109
-
110
-
111
-
112
-
113
-
114
-
115
-
116
-
117
-
118
-
119
-
120
-
121
-
122
-
123
-
124
-
125
-
126
-
127
-
128
-
129
-
130
-
131
-
132
-
133
-
134
-
135
-
136
-
137
-
138
-
139
-
140
-
141
-
142
-
143
-
144
-
 145
145 -
 146
146 -
 147
147 -
 148
148 -
 149
149 -
 150
150 -
 151
151 -
 152
152 -
 153
153 -
 154
154 -
 155
155 -
 156
156 -
 157
157 -
 158
158 -
 159
159 -
 160
160 -
 161
161 -
 162
162 -
 163
163 -
 164
164 -
 165
165 -
166
-
167
-
168
-
169
-
170
-
171
-
172
-
173
-
174
-
175
-
176
 |
 |

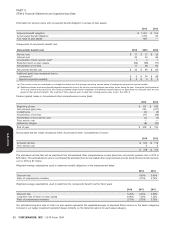
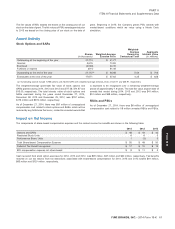
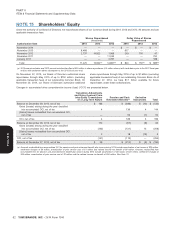
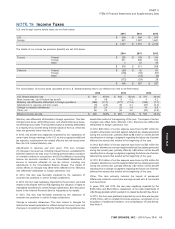
PART II
ITEM 8 Financial Statements and Supplementary Data
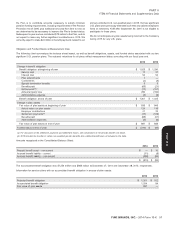
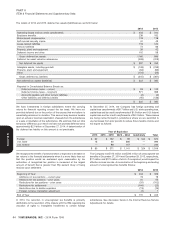
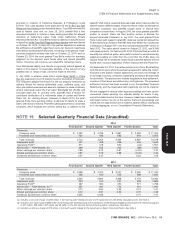
The fair values of RSU awards are based on the closing price of our grant. Beginning in 2013, the Company grants PSU awards with
stock on the date of grant. The fair values of PSU awards granted prior market-based conditions which we value using a Monte Carlo
to 2013 are based on the closing price of our stock on the date of simulation.
Award Activity
Stock Options and SARs
Weighted-
Average Aggregate
Shares Weighted-Average Remaining Intrinsic Value
(in thousands) Exercise Price Contractual Term (in millions)
Outstanding at the beginning of the year 27,713 $ 41.77
Granted 3,619 70.85
Exercised (3,549) 30.35
Forfeited or expired (611) 61.48
Outstanding at the end of the year 27,172(a) $ 46.68 5.54 $ 703
Exercisable at the end of the year 17,671 $ 37.62 4.25 $ 628
(a) Outstanding awards include 1,968 options and 25,204 SARs with weighted average exercise prices of $43.71 and $46.91, respectively.
The weighted-average grant-date fair value of stock options and is expected to be recognized over a remaining weighted-average
SARs granted during 2014, 2013 and 2012 was $17.28, $14.67 and period of approximately 1.9 years. The total fair value at grant date of
$15.00, respectively. The total intrinsic value of stock options and awards that vested during 2014, 2013 and 2012 was $41 million,
SARs exercised during the years ended December 27, 2014, $51 million and $48 million, respectively.
December 28, 2013 and December 29, 2012, was $157 million,
$176 million and $319 million, respectively. RSUs and PSUs
As of December 27, 2014, there was $91 million of unrecognized As of December 27, 2014, there was $6 million of unrecognized
compensation cost related to stock options and SARs, which will be compensation cost related to 0.8 million unvested RSUs and PSUs.
reduced by any forfeitures that occur, related to unvested awards that
Impact on Net Income
The components of share-based compensation expense and the related income tax benefits are shown in the following table:
2014 2013 2012
Options and SARs $48 $44 $42
Restricted Stock Units 665
Performance Share Units 1(1)3
Total Share-based Compensation Expense $ 55 $ 49 $ 50
Deferred Tax Benefit recognized $17 $15 $15
EID compensation expense not share-based $ 8 $ 11 $ 5
Cash received from stock option exercises for 2014, 2013 and 2012, was $29 million, $37 million and $62 million, respectively. Tax benefits
realized on our tax returns from tax deductions associated with share-based compensation for 2014, 2013 and 2012 totaled $61 million,
$65 million and $120 million, respectively.
YUM! BRANDS, INC. - 2014 Form 10-K 61
13MAR201516053226
Form 10-K