Pizza Hut 2014 Annual Report Download - page 118
Download and view the complete annual report
Please find page 118 of the 2014 Pizza Hut annual report below. You can navigate through the pages in the report by either clicking on the pages listed below, or by using the keyword search tool below to find specific information within the annual report.-
 1
1 -
2
-
3
-
4
-
5
-
6
-
7
-
8
-
9
-
10
-
11
-
12
-
13
-
14
-
15
-
16
-
17
-
18
-
19
-
20
-
21
-
22
-
23
-
24
-
25
-
26
-
27
-
28
-
29
-
30
-
31
-
32
-
33
-
34
-
35
-
36
-
37
-
38
-
39
-
40
-
41
-
42
-
43
-
44
-
45
-
46
-
47
-
48
-
49
-
50
-
51
-
52
-
53
-
54
-
55
-
56
-
57
-
58
-
59
-
60
-
61
-
62
-
63
-
64
-
65
-
66
-
67
-
68
-
69
-
70
-
71
-
72
-
73
-
74
-
75
-
76
-
77
-
78
-
79
-
80
-
81
-
82
-
83
-
84
-
85
-
86
-
87
-
88
-
89
-
90
-
91
-
92
-
93
-
94
-
95
-
96
-
97
-
98
-
99
-
100
-
101
-
102
-
103
-
104
-
105
-
106
-
107
-
 108
108 -
 109
109 -
 110
110 -
 111
111 -
 112
112 -
 113
113 -
 114
114 -
 115
115 -
 116
116 -
 117
117 -
 118
118 -
 119
119 -
 120
120 -
 121
121 -
 122
122 -
 123
123 -
 124
124 -
 125
125 -
 126
126 -
 127
127 -
 128
128 -
129
-
130
-
131
-
132
-
133
-
134
-
135
-
136
-
137
-
138
-
139
-
140
-
141
-
142
-
143
-
144
-
145
-
146
-
147
-
148
-
149
-
150
-
151
-
152
-
153
-
154
-
155
-
156
-
157
-
158
-
159
-
160
-
161
-
162
-
163
-
164
-
165
-
166
-
167
-
168
-
169
-
170
-
171
-
172
-
173
-
174
-
175
-
176
 |
 |

13MAR201517272138
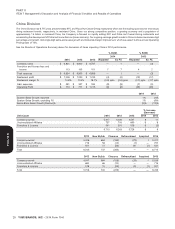
PART II
ITEM 7 Management’s Discussion and Analysis of Financial Condition and Results of Operations
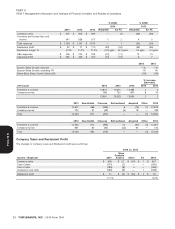
% B/(W) % B/(W)
2014 2013
2014 2013 2012 Reported Ex FX Reported Ex FX
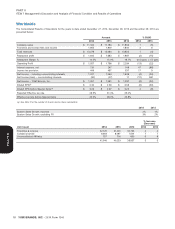
Company sales $ 607 $ 609 $ 993 — (1) (39) (39)
Franchise and license fees and
income 541 538 517 1 2 4 5
Total revenues $ 1,148 $ 1,147 $ 1,510 — 1 (24) (24)
Restaurant profit $ 50 $ 71 $ 110 (30) (32) (36) (36)
Restaurant margin % 8.2% 11.7% 11.2% (3.5) ppts. (3.7) ppts. 0.5 ppts. 0.4 ppts.
G&A expenses $ 246 $ 224 $ 258 (10) (11) 13 13
Operating Profit $ 295 $ 339 $ 320 (13) (13) 6 7
2014 2013
System Sales Growth, reported —% —%
System Sales Growth, excluding FX 1% 1%
Same-Store Sales Growth (Decline)% (1)% (1)%
% Increase
(Decrease)
Unit Count 2014 2013 2012 2014 2013
Franchise & License 12,814 12,601 12,393 2 2
Company-owned 788 732 667 8 10
13,602 13,333 13,060 2 2
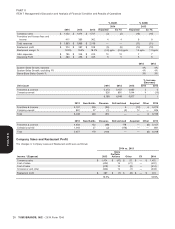
2013 New Builds Closures Refranchised Acquired Other 2014
Franchise & License 12,601 586 (359) 6 (19) (1) 12,814
Company-owned 732 91 (48) (6) 19 — 788
Total 13,333 677 (407) — — (1) 13,602
2012 New Builds Closures Refranchised Acquired Other 2013
Franchise & License 12,393 612 (363) 22 (60) (3) 12,601
Company-owned 667 80 (53) (22) 60 — 732
Total 13,060 692 (416) — — (3) 13,333
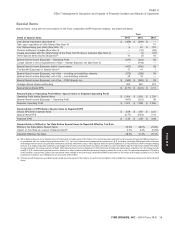
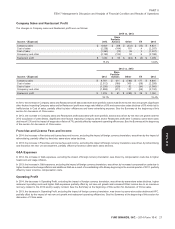
Company Sales and Restaurant Profit
The changes in Company sales and Restaurant profit were as follows:
2014 vs. 2013
Store
Portfolio
Income / (Expense) 2013 Actions Other FX 2014
Company sales $ 609 $ 21 $ (24) $ 1 $ 607
Cost of sales (173) (7) — — (180)
Cost of labor (183) (9) 4 — (188)
Occupancy and other (182) (8) — 1 (189)
Restaurant profit $ 71 $ (3) $ (20) $ 2 $ 50
11.7% 8.2%
24 YUM! BRANDS, INC. - 2014 Form 10-K
Form 10-K