Pizza Hut 2014 Annual Report Download - page 121
Download and view the complete annual report
Please find page 121 of the 2014 Pizza Hut annual report below. You can navigate through the pages in the report by either clicking on the pages listed below, or by using the keyword search tool below to find specific information within the annual report.-
 1
1 -
2
-
3
-
4
-
5
-
6
-
7
-
8
-
9
-
10
-
11
-
12
-
13
-
14
-
15
-
16
-
17
-
18
-
19
-
20
-
21
-
22
-
23
-
24
-
25
-
26
-
27
-
28
-
29
-
30
-
31
-
32
-
33
-
34
-
35
-
36
-
37
-
38
-
39
-
40
-
41
-
42
-
43
-
44
-
45
-
46
-
47
-
48
-
49
-
50
-
51
-
52
-
53
-
54
-
55
-
56
-
57
-
58
-
59
-
60
-
61
-
62
-
63
-
64
-
65
-
66
-
67
-
68
-
69
-
70
-
71
-
72
-
73
-
74
-
75
-
76
-
77
-
78
-
79
-
80
-
81
-
82
-
83
-
84
-
85
-
86
-
87
-
88
-
89
-
90
-
91
-
92
-
93
-
94
-
95
-
96
-
97
-
98
-
99
-
100
-
101
-
102
-
103
-
104
-
105
-
106
-
107
-
108
-
109
-
110
-
 111
111 -
 112
112 -
 113
113 -
 114
114 -
 115
115 -
 116
116 -
 117
117 -
 118
118 -
 119
119 -
 120
120 -
 121
121 -
 122
122 -
 123
123 -
 124
124 -
 125
125 -
 126
126 -
 127
127 -
 128
128 -
 129
129 -
 130
130 -
 131
131 -
132
-
133
-
134
-
135
-
136
-
137
-
138
-
139
-
140
-
141
-
142
-
143
-
144
-
145
-
146
-
147
-
148
-
149
-
150
-
151
-
152
-
153
-
154
-
155
-
156
-
157
-
158
-
159
-
160
-
161
-
162
-
163
-
164
-
165
-
166
-
167
-
168
-
169
-
170
-
171
-
172
-
173
-
174
-
175
-
176
 |
 |

PART II
ITEM 7 Management’s Discussion and Analysis of Financial Condition and Results of Operations
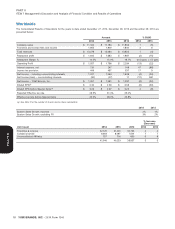
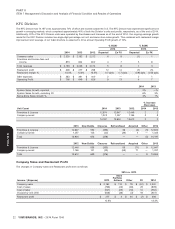
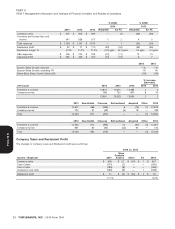
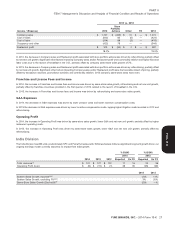
2013 vs. 2012
Store
Portfolio
Income / (Expense) 2012 Actions Other FX 2013
Company sales $ 1,747 $ (283) $ 10 $ — $ 1,474
Cost of sales (502) 83 (5) — (424)
Cost of labor (504) 88 (3) — (419)
Occupancy and other (422) 78 — — (344)
Restaurant profit $ 319 $ (34) $ 2 $ — $ 287
18.2% 19.5%
In 2014, the decrease in Company sales and Restaurant profit associated with store portfolio actions was driven by refranchising, partially offset
by net new unit growth. Significant other factors impacting Company sales and/or Restaurant profit were commodity inflation and higher food and
labor costs due to the launch of breakfast in the U.S., partially offset by company same-store sales growth of 2%.
In 2013, the decrease in Company sales and Restaurant profit associated with store portfolio actions was driven by refranchising, partially offset
by net new unit growth. Significant other factors impacting Company sales and/or Restaurant profit were the favorable impact of pricing, partially
offset by transaction declines, promotional activities and commodity inflation. 2013 company same-store sales were even.
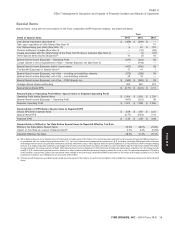
Franchise and License Fees and Income
In 2014, the increase in Franchise and license fees and income was driven by same-store sales growth, refranchising and net new unit growth,
partially offset by franchise incentives provided in the first quarter of 2014 related to the launch of breakfast in the U.S.
In 2013, the increase in Franchise and license fees and income was driven by refranchising and same-store sales growth.
G&A Expenses
In 2014, the decrease in G&A expenses was driven by lower pension costs and lower incentive compensation costs.
In 2013 the decrease in G&A expenses was driven by lower incentive compensation costs, lapping higher litigation costs recorded in 2012 and
refranchising.
Operating Profit
In 2014, the increase in Operating Profit was driven by same-store sales growth, lower G&A and net new unit growth, partially offset by higher
restaurant operating costs.
In 2013, the increase in Operating Profit was driven by same-store sales growth, lower G&A and net new unit growth, partially offset by
refranchising.
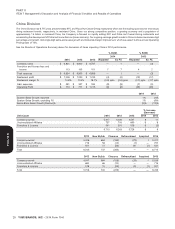
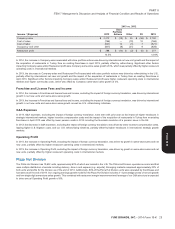
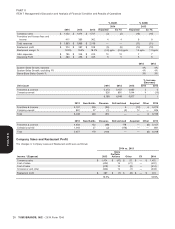
India Division
The India Division has 833 units, predominately KFC and Pizza Hut restaurants. While we believe India is a significant long-term growth driver, our
ongoing earnings model currently assumes no impact from India growth.
% B/(W) % B/(W)
2014 2013
2014 2013 2012 Reported Ex FX Reported Ex FX
Total revenues(a) $ 141 $ 127 $ 102 11 16 24 36
Operating Profit (loss) $ (9) $ (15) $ (1) 39 35 NM NM
2014 2013
System Sales Growth, reported(a)(b) (1)% 11%
System Sales Growth, excluding FX(a)(b) 3% 20%
Same-Store Sales Growth (Decline)%(b) (5)% —%
YUM! BRANDS, INC. - 2014 Form 10-K 27
13MAR201516053226
Form 10-K