Pizza Hut 2014 Annual Report Download - page 127
Download and view the complete annual report
Please find page 127 of the 2014 Pizza Hut annual report below. You can navigate through the pages in the report by either clicking on the pages listed below, or by using the keyword search tool below to find specific information within the annual report.-
 1
1 -
2
-
3
-
4
-
5
-
6
-
7
-
8
-
9
-
10
-
11
-
12
-
13
-
14
-
15
-
16
-
17
-
18
-
19
-
20
-
21
-
22
-
23
-
24
-
25
-
26
-
27
-
28
-
29
-
30
-
31
-
32
-
33
-
34
-
35
-
36
-
37
-
38
-
39
-
40
-
41
-
42
-
43
-
44
-
45
-
46
-
47
-
48
-
49
-
50
-
51
-
52
-
53
-
54
-
55
-
56
-
57
-
58
-
59
-
60
-
61
-
62
-
63
-
64
-
65
-
66
-
67
-
68
-
69
-
70
-
71
-
72
-
73
-
74
-
75
-
76
-
77
-
78
-
79
-
80
-
81
-
82
-
83
-
84
-
85
-
86
-
87
-
88
-
89
-
90
-
91
-
92
-
93
-
94
-
95
-
96
-
97
-
98
-
99
-
100
-
101
-
102
-
103
-
104
-
105
-
106
-
107
-
108
-
109
-
110
-
111
-
112
-
113
-
114
-
115
-
116
-
 117
117 -
 118
118 -
 119
119 -
 120
120 -
 121
121 -
 122
122 -
 123
123 -
 124
124 -
 125
125 -
 126
126 -
 127
127 -
 128
128 -
 129
129 -
 130
130 -
 131
131 -
 132
132 -
 133
133 -
 134
134 -
 135
135 -
 136
136 -
 137
137 -
138
-
139
-
140
-
141
-
142
-
143
-
144
-
145
-
146
-
147
-
148
-
149
-
150
-
151
-
152
-
153
-
154
-
155
-
156
-
157
-
158
-
159
-
160
-
161
-
162
-
163
-
164
-
165
-
166
-
167
-
168
-
169
-
170
-
171
-
172
-
173
-
174
-
175
-
176
 |
 |

PART II
ITEM 7 Management’s Discussion and Analysis of Financial Condition and Results of Operations
agreement is at prevailing market rates our primary consideration is standard deviations or more above the mean. In considering possible
consistency with the terms of our current franchise agreements both bond portfolios, the model allows the bond cash flows for a particular
within the country that the restaurants are being refranchised in and year to exceed the expected benefit payment cash flows for that year.
around the world. The Company believes consistency in royalty rates Such excesses are assumed to be reinvested at appropriate one-year
as a percentage of sales is appropriate as the Company and forward rates and used to meet the benefit payment cash flows in a
franchisee share in the impact of near-term fluctuations in sales future year. The weighted-average yield of this hypothetical portfolio
results with the acknowledgment that over the long-term the royalty was used to arrive at an appropriate discount rate. We also ensure
rate represents an appropriate rate for both parties. that changes in the discount rate as compared to the prior year are
consistent with the overall change in prevailing market rates and make
The discounted value of the future cash flows expected to be adjustments as necessary. A 50 basis-point increase in this discount
generated by the restaurant and retained by the franchisee is reduced rate would have decreased these U.S. plans’ PBOs by approximately
by future royalties the franchisee will pay the Company. The Company $100 million at our measurement date. Conversely, a 50 basis-point
thus considers the fair value of future royalties to be received under decrease in this discount rate would have increased our U.S. plans’
the franchise agreement as fair value retained in its determination of PBOs by approximately $110 million at our measurement date.
the goodwill to be written off when refranchising. Others may consider
the fair value of these future royalties as fair value disposed of and The pension expense we will record in 2015 is also impacted by the
thus would conclude that a larger percentage of a reporting unit’s fair discount rate, as well as the long-term rates of return on plan assets
value is disposed of in a refranchising transaction. and mortality assumptions we selected at our measurement date. We
expect pension expense for our U.S. plans to increase approximately
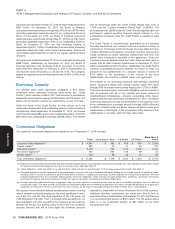
During 2014, the Company’s most significant refranchising activity $25 million in 2015. The increase is primarily driven by an increase in
was within our China operating segment, where 79 restaurants were amortization of net loss due to higher net unrecognized losses in
refranchised (representing approximately 2% of beginning-of-year Accumulated other comprehensive income. Higher net unrecognized
company units) and less than $1 million in goodwill was written off losses in Accumulated other comprehensive income are primarily a
(representing approximately 1% of beginning-of-year goodwill). result of a lower discount rate at our 2014 measurement date. A 50
basis-point change in our discount rate assumption at our
See Note 2 for a further discussion of our policies regarding goodwill.
measurement date would impact our 2015 U.S. pension expense by
approximately $13 million.
Self-Insured Property and Casualty Our estimated long-term rate of return on U.S. plan assets is based
Losses upon the weighted-average of historical returns for each asset
category. Our expected long-term rate of return on U.S. plan assets,
We record our best estimate of the remaining cost to settle incurred for purposes of determining 2015 pension expense, at December 27,
self-insured workers’ compensation, employment practices liability, 2014 was 6.75%. We believe this rate is appropriate given the
general liability, automobile liability, product liability and property composition of our plan assets and historical market returns thereon.
losses (collectively ‘‘property and casualty losses’’). The estimate is A 100 basis point change in our expected long-term rate of return on
based on the results of an independent actuarial study and considers plan assets assumption would impact our 2015 U.S. pension expense
historical claim frequency and severity as well as changes in factors by approximately $9 million. Additionally, every 100 basis point
such as our business environment, benefit levels, medical costs and variation in actual return on plan assets versus our expected return of
the regulatory environment that could impact overall self-insurance 6.75% will impact our unrecognized pre-tax actuarial net loss by
costs. Additionally, our reserve includes a risk margin to cover approximately $9 million.
unforeseen events that may occur over the several years required to
settle claims, increasing our confidence level that the recorded Assumptions as to mortality of the participants in our U.S. defined
reserve is adequate. benefit pension plans are key estimates in measuring the expected
payments which participants may receive over their lifetimes and
See Note 18 for a further discussion of our insurance programs. therefore the amount of expense we will recognize. In determining the
most appropriate mortality assumptions for our U.S. defined benefit
pension plans at December 27, 2014, we considered the updated
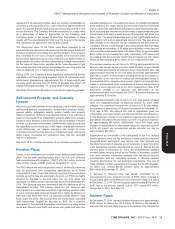
Pension Plans
mortality tables recently issued by the Society of Actuaries, coupled
Certain of our employees are covered under defined benefit pension with other mortality information available from the Social Security
plans. Our two most significant plans are in the U.S. and combined Administration and our consulting actuaries to develop updated
had a projected benefit obligation (‘‘PBO’’) of $1,301 million and a fair mortality assumptions for our participant populations. The use of
value of plan assets of $991 million at December 27, 2014. these updated mortality assumptions increased the benefit obligation
for these U.S. defined benefit pension plans by approximately
The PBO reflects the actuarial present value of all benefits earned to $46 million at December 27, 2014.
date by employees and incorporates assumptions as to future
compensation levels. Due to the relatively long time frame over which A decrease in discount rates has largely contributed to an
benefits earned to date are expected to be paid, our PBOs are highly unrecognized pre-tax actuarial net loss of $314 million included in
sensitive to changes in discount rates. For our U.S. plans, we Accumulated other comprehensive income (loss) for these U.S. plans
measured our PBOs using a discount rate of 4.30% at December 27, at December 27, 2014. We will recognize approximately $45 million of
2014. This discount rate was determined with the assistance of our such loss in net periodic benefit cost in 2015 versus $17 million
independent actuary. The primary basis for our discount rate recognized in 2014. See Note 13.
determination is a model that consists of a hypothetical portfolio of ten
or more corporate debt instruments rated Aa or higher by Moody’s or
S&P with cash flows that mirror our expected benefit payment cash Income Taxes
flows under the plans. We exclude from the model those corporate At December 27, 2014, we had valuation allowances of approximately
debt instruments flagged by Moody’s or S&P for a potential $230 million to reduce our $1.2 billion of deferred tax assets to
downgrade (if the potential downgrade would result in a rating below amounts that are more likely than not to be realized. The net deferred
Aa by both Moody’s and S&P) and bonds with yields that were two
YUM! BRANDS, INC. - 2014 Form 10-K 33
13MAR201516053226
Form 10-K