Pizza Hut 2014 Annual Report Download - page 52
Download and view the complete annual report
Please find page 52 of the 2014 Pizza Hut annual report below. You can navigate through the pages in the report by either clicking on the pages listed below, or by using the keyword search tool below to find specific information within the annual report.-
 1
1 -
2
-
3
-
4
-
5
-
6
-
7
-
8
-
9
-
10
-
11
-
12
-
13
-
14
-
15
-
16
-
17
-
18
-
19
-
20
-
21
-
22
-
23
-
24
-
25
-
26
-
27
-
28
-
29
-
30
-
31
-
32
-
33
-
34
-
35
-
36
-
37
-
38
-
39
-
40
-
41
-
 42
42 -
 43
43 -
 44
44 -
 45
45 -
 46
46 -
 47
47 -
 48
48 -
 49
49 -
 50
50 -
 51
51 -
 52
52 -
 53
53 -
 54
54 -
 55
55 -
 56
56 -
 57
57 -
 58
58 -
 59
59 -
 60
60 -
 61
61 -
 62
62 -
63
-
64
-
65
-
66
-
67
-
68
-
69
-
70
-
71
-
72
-
73
-
74
-
75
-
76
-
77
-
78
-
79
-
80
-
81
-
82
-
83
-
84
-
85
-
86
-
87
-
88
-
89
-
90
-
91
-
92
-
93
-
94
-
95
-
96
-
97
-
98
-
99
-
100
-
101
-
102
-
103
-
104
-
105
-
106
-
107
-
108
-
109
-
110
-
111
-
112
-
113
-
114
-
115
-
116
-
117
-
118
-
119
-
120
-
121
-
122
-
123
-
124
-
125
-
126
-
127
-
128
-
129
-
130
-
131
-
132
-
133
-
134
-
135
-
136
-
137
-
138
-
139
-
140
-
141
-
142
-
143
-
144
-
145
-
146
-
147
-
148
-
149
-
150
-
151
-
152
-
153
-
154
-
155
-
156
-
157
-
158
-
159
-
160
-
161
-
162
-
163
-
164
-
165
-
166
-
167
-
168
-
169
-
170
-
171
-
172
-
173
-
174
-
175
-
176
 |
 |
6MAR201514275530
15MAR201511093851
6MAR201514275387
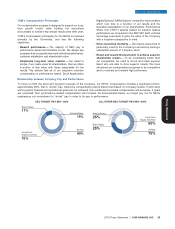
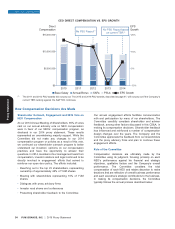
Based on the Company’s 2014 performance, cash compensation was significantly below target. This was primarily due to below
target results at our China and Pizza Hut divisions. Cash compensation (base salary and annual bonus) was 48% below target for
the CEO and on average 24% below target for the other NEOs. As shown to the right, bonus payouts to four out of the five NEOs
were below target.
NEO ACTUAL BONUS VS. TARGET
NOVAK
Actual (%)
SU CREED
Tar g et
Bonus
22% 30%
126%
BERGREN
37%
GRISMER
33%
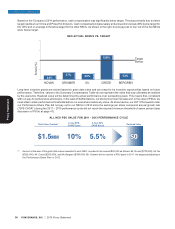
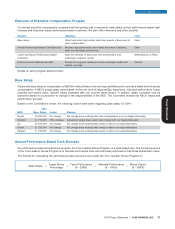
Long-term incentive grants are valued based on grant date value and are meant to be incentive opportunities based on future
performance. Therefore, values in the Summary Compensation Table do not represent the value that may ultimately be realized
by the executive. Realized value will be determined by actual performance over succeeding years. This means that, consistent
with our pay-for performance philosophy, in the case of SARs/Options, our stock price must increase and, in the case of PSUs, we
must attain certain performance thresholds before our executives realize any value. As shown below, our 2011 PSU award under
our Performance Share Plan did not pay out to our NEOs in 2014 since the earnings per share compound annual growth rate
(‘‘EPS CAGR’’) during the 2011 – 2013 performance cycle did not reach the required minimum threshold of seven percent (see
discussion of PSUs at page 41).
ALL NEO PSU VALUE FOR 2011 – 2013 PERFORMANCE CYCLE
Total Value Granted(1) 3-Year EPS
CAGR Target
3-Year EPS
CAGR Actual Realized Value
$1.5MM 10% 5.5% $0
$0$0
$0
(1) Amount is the sum of the grant date values awarded to each NEO, rounded to the nearest $25,000 as follows: Mr. Novak ($773,000), Mr. Su
($325,000), Mr. Creed ($205,000), and Mr. Bergren ($190,000). Mr. Grismer did not receive a PSU grant in 2011. He began participating in
the Performance Share Plan in 2012.
30 YUM! BRANDS, INC. 2015 Proxy Statement
EXECUTIVE COMPENSATION
Proxy Statement