Pizza Hut 2014 Annual Report Download - page 73
Download and view the complete annual report
Please find page 73 of the 2014 Pizza Hut annual report below. You can navigate through the pages in the report by either clicking on the pages listed below, or by using the keyword search tool below to find specific information within the annual report.-
 1
1 -
2
-
3
-
4
-
5
-
6
-
7
-
8
-
9
-
10
-
11
-
12
-
13
-
14
-
15
-
16
-
17
-
18
-
19
-
20
-
21
-
22
-
23
-
24
-
25
-
26
-
27
-
28
-
29
-
30
-
31
-
32
-
33
-
34
-
35
-
36
-
37
-
38
-
39
-
40
-
41
-
42
-
43
-
44
-
45
-
46
-
47
-
48
-
49
-
50
-
51
-
52
-
53
-
54
-
55
-
56
-
57
-
58
-
59
-
60
-
61
-
62
-
 63
63 -
 64
64 -
 65
65 -
 66
66 -
 67
67 -
 68
68 -
 69
69 -
 70
70 -
 71
71 -
 72
72 -
 73
73 -
 74
74 -
 75
75 -
 76
76 -
 77
77 -
 78
78 -
 79
79 -
 80
80 -
 81
81 -
 82
82 -
 83
83 -
84
-
85
-
86
-
87
-
88
-
89
-
90
-
91
-
92
-
93
-
94
-
95
-
96
-
97
-
98
-
99
-
100
-
101
-
102
-
103
-
104
-
105
-
106
-
107
-
108
-
109
-
110
-
111
-
112
-
113
-
114
-
115
-
116
-
117
-
118
-
119
-
120
-
121
-
122
-
123
-
124
-
125
-
126
-
127
-
128
-
129
-
130
-
131
-
132
-
133
-
134
-
135
-
136
-
137
-
138
-
139
-
140
-
141
-
142
-
143
-
144
-
145
-
146
-
147
-
148
-
149
-
150
-
151
-
152
-
153
-
154
-
155
-
156
-
157
-
158
-
159
-
160
-
161
-
162
-
163
-
164
-
165
-
166
-
167
-
168
-
169
-
170
-
171
-
172
-
173
-
174
-
175
-
176
 |
 |

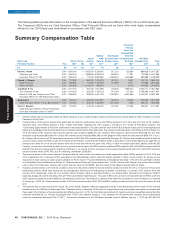
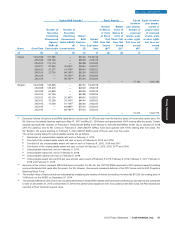
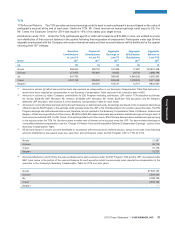
Creed 1/24/2008 107,085 — $37.30 1/24/2018
2/5/2009 169,148 — $29.29 2/5/2019
2/5/2010 172,118 — $32.98 2/5/2020
2/4/2011 91,650 30,550(i) $49.30 2/4/2021
2/8/2012 41,377 41,378(ii) $64.44 2/8/2022
2/6/2013 22,730 68,193(iii) $62.93 2/6/2023
2/5/2014 — 78,050(iv) $70.54 2/5/2024
2/5/2014 — 68,767(vii) $70.54 2/5/2024
— — 17,162 1,250,252
Bergren 1/24/2008 133,856 — $37.30 1/24/2018
2/5/2009 135,318 — $29.29 2/5/2019
2/5/2009 67,659 — $29.29 2/5/2019
2/5/2010 81,756 — $32.98 2/5/2020
2/4/2011 61,100 20,367(i) $49.30 2/4/2021
2/8/2012 37,239 37,240(ii) $64.44 2/8/2022
2/6/2013 17,048 51,145(iii) $62.93 2/6/2023
2/5/2014 — 64,985(iv) $70.54 2/5/2024
2/5/2014 — 68,767(viii) $70.54 2/5/2024
— — 14,314 1,042,775
(1) Except as follows, all options and SARs listed above vest at a rate of 25% per year over the first four years of the ten-year option term. For
Mr. Grismer, the awards listed as expiring on May 17, 2017 and May 21, 2019 were each granted with 100% vesting after four years. Certain
awards expiring for Mr. Grismer on February 5, 2020 (43,030 SARs) and February 6, 2024 (45,462 SARs), for Mr. Su on January 24, 2018
(267,712 options), and for Mr. Creed on February 5, 2024 (68,767 SARs), were each granted with 100% vesting after five years. For
Mr. Bergren, the award expiring on February 5, 2024 (68,767 SARs) vests 20% per year over five years.
The actual vesting dates for unexercisable awards are as follows:
(i) Remainder of unexercisable awards will vest on February 4, 2015.
(ii) One-half of the unexercisable award will vest on each of February 8, 2015 and 2016.
(iii) One-third of the unexercisable award will vest on each of February 6, 2015, 2016 and 2017.
(iv) One-fourth of the unexercisable award will vest on each of February 5, 2015, 2016, 2017 and 2018.
(v) Unexercisable award will vest on February 5, 2015.
(vi) Unexercisable award will vest on February 6, 2018.
(vii) Unexercisable awards will vest on February 5, 2019.
(viii) Unexercisable award will vest 20% per year and will vest on each of February 5, 2015, February 5, 2016, February 5, 2017, February 5,
2018 and February 5, 2019.
(2) Amounts in this column represent RSUs that have not vested. For Mr. Su, the 187,150 RSUs represent a 2010 retention award (including
accrued dividends) that vests after five years. For Mr. Grismer, this amount represents deferral of his 2012 bonus into the EID Program’s
Matching Stock Fund.
(3) The market value of these awards are calculated by multiplying the number of shares covered by the award by $72.85, the closing price of
YUM stock on the NYSE on December 31, 2014.
(4) The awards reflected in this column are unvested performance-based PSU awards with three-year performance periods that are scheduled
to vest on December 31, 2015 or December 31, 2016 if the performance targets are met. In accordance with SEC rules, the PSU awards are
reported at their maximum payout value.
2015 Proxy Statement YUM! BRANDS, INC. 51
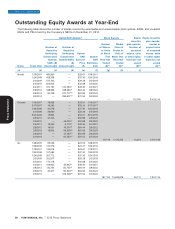
Option/SAR Awards(1) Stock Awards Equity Equity incentive
incentive plan awards:
Number Market plan awards: market or
Number of Number of of Shares Value of Number of payout value
Securities Securities or Units Shares or unearned of unearned
Underlying Underlying Option/ of Stock Units of shares, units shares, units
Unexercised Unexercised SAR Option/ That Stock That or other rights or other rights
Options/ Options/SARs Exercise SAR Have Not Have Not that have not that have not
SARs (#) (#) Price Expiration Vested Vested vested vested
Name Grant Date Exercisable Unexercisable ($) Date (#)(2) ($)(3) (#)(4) ($)(3)
(a) (b) (c) (d) (e) (f) (g) (h) (i)
EXECUTIVE COMPENSATION
Proxy Statement