Pizza Hut 2014 Annual Report Download - page 146
Download and view the complete annual report
Please find page 146 of the 2014 Pizza Hut annual report below. You can navigate through the pages in the report by either clicking on the pages listed below, or by using the keyword search tool below to find specific information within the annual report.-
 1
1 -
2
-
3
-
4
-
5
-
6
-
7
-
8
-
9
-
10
-
11
-
12
-
13
-
14
-
15
-
16
-
17
-
18
-
19
-
20
-
21
-
22
-
23
-
24
-
25
-
26
-
27
-
28
-
29
-
30
-
31
-
32
-
33
-
34
-
35
-
36
-
37
-
38
-
39
-
40
-
41
-
42
-
43
-
44
-
45
-
46
-
47
-
48
-
49
-
50
-
51
-
52
-
53
-
54
-
55
-
56
-
57
-
58
-
59
-
60
-
61
-
62
-
63
-
64
-
65
-
66
-
67
-
68
-
69
-
70
-
71
-
72
-
73
-
74
-
75
-
76
-
77
-
78
-
79
-
80
-
81
-
82
-
83
-
84
-
85
-
86
-
87
-
88
-
89
-
90
-
91
-
92
-
93
-
94
-
95
-
96
-
97
-
98
-
99
-
100
-
101
-
102
-
103
-
104
-
105
-
106
-
107
-
108
-
109
-
110
-
111
-
112
-
113
-
114
-
115
-
116
-
117
-
118
-
119
-
120
-
121
-
122
-
123
-
124
-
125
-
126
-
127
-
128
-
129
-
130
-
131
-
132
-
133
-
134
-
135
-
 136
136 -
 137
137 -
 138
138 -
 139
139 -
 140
140 -
 141
141 -
 142
142 -
 143
143 -
 144
144 -
 145
145 -
 146
146 -
 147
147 -
 148
148 -
 149
149 -
 150
150 -
 151
151 -
 152
152 -
 153
153 -
 154
154 -
 155
155 -
 156
156 -
157
-
158
-
159
-
160
-
161
-
162
-
163
-
164
-
165
-
166
-
167
-
168
-
169
-
170
-
171
-
172
-
173
-
174
-
175
-
176
 |
 |

13MAR201517272138
PART II
ITEM 8 Financial Statements and Supplementary Data
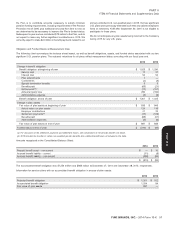
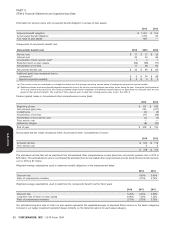
Franchise and License Fees and Income
2014 2013 2012
Initial fees, including renewal fees $ 83 $ 90 $ 92
Initial franchise fees included in Refranchising (gain) loss (5) (13) (24)
78 77 68
Continuing fees and rental income 1,877 1,823 1,732
Franchise and license fees and income $ 1,955 $ 1,900 $ 1,800
Other (Income) Expense
2014 2013 2012
Equity (income) loss from investments in unconsolidated affiliates $ (30) $ (26) $ (47)
Gain upon acquisition of Little Sheep(a) — — (74)
China poultry supply insurance recovery(b) (25) — —
Foreign exchange net (gain) loss and other 14 10 6
Other (income) expense $ (41) $ (16) $ (115)
(a) See Note 4.
(b) Recovery related to lost profits associated with a 2012 poultry supply incident.
Supplemental Balance Sheet Information
Prepaid Expenses and Other Current Assets 2014 2013
Income tax receivable $55 $89
Assets held for sale(a) 14 16
Other prepaid expenses and current assets 185 181
Prepaid expenses and other current assets $ 254 $ 286
(a) Reflects restaurants we have offered for sale to franchisees and excess properties that we do not intend to use for restaurant operations in the future.
Property, Plant and Equipment 2014 2013
Land $ 506 $ 508
Buildings and improvements 4,549 4,393
Capital leases, primarily buildings 210 199
Machinery and equipment 2,817 2,750
Property, plant and equipment, gross 8,082 7,850
Accumulated depreciation and amortization (3,584) (3,391)
Property, plant and equipment, net $ 4,498 $ 4,459
Depreciation and amortization expense related to property, plant and equipment was $702 million, $686 million and $629 million in 2014, 2013
and 2012, respectively.
Accounts Payable and Other Current Liabilities 2014 2013
Accounts payable $ 694 $ 692
Accrued capital expenditures 250 235
Accrued compensation and benefits 419 442
Dividends payable 178 164
Accrued taxes, other than income taxes 100 93
Other current liabilities 331 303
Accounts payable and other current liabilities $ 1,972 $ 1,929
52 YUM! BRANDS, INC. - 2014 Form 10-K
NOTE 6
NOTE 7
NOTE 8
Form 10-K