Pizza Hut 2014 Annual Report Download - page 153
Download and view the complete annual report
Please find page 153 of the 2014 Pizza Hut annual report below. You can navigate through the pages in the report by either clicking on the pages listed below, or by using the keyword search tool below to find specific information within the annual report.-
 1
1 -
2
-
3
-
4
-
5
-
6
-
7
-
8
-
9
-
10
-
11
-
12
-
13
-
14
-
15
-
16
-
17
-
18
-
19
-
20
-
21
-
22
-
23
-
24
-
25
-
26
-
27
-
28
-
29
-
30
-
31
-
32
-
33
-
34
-
35
-
36
-
37
-
38
-
39
-
40
-
41
-
42
-
43
-
44
-
45
-
46
-
47
-
48
-
49
-
50
-
51
-
52
-
53
-
54
-
55
-
56
-
57
-
58
-
59
-
60
-
61
-
62
-
63
-
64
-
65
-
66
-
67
-
68
-
69
-
70
-
71
-
72
-
73
-
74
-
75
-
76
-
77
-
78
-
79
-
80
-
81
-
82
-
83
-
84
-
85
-
86
-
87
-
88
-
89
-
90
-
91
-
92
-
93
-
94
-
95
-
96
-
97
-
98
-
99
-
100
-
101
-
102
-
103
-
104
-
105
-
106
-
107
-
108
-
109
-
110
-
111
-
112
-
113
-
114
-
115
-
116
-
117
-
118
-
119
-
120
-
121
-
122
-
123
-
124
-
125
-
126
-
127
-
128
-
129
-
130
-
131
-
132
-
133
-
134
-
135
-
136
-
137
-
138
-
139
-
140
-
141
-
142
-
 143
143 -
 144
144 -
 145
145 -
 146
146 -
 147
147 -
 148
148 -
 149
149 -
 150
150 -
 151
151 -
 152
152 -
 153
153 -
 154
154 -
 155
155 -
 156
156 -
 157
157 -
 158
158 -
 159
159 -
 160
160 -
 161
161 -
 162
162 -
 163
163 -
164
-
165
-
166
-
167
-
168
-
169
-
170
-
171
-
172
-
173
-
174
-
175
-
176
 |
 |

PART II
ITEM 8 Financial Statements and Supplementary Data
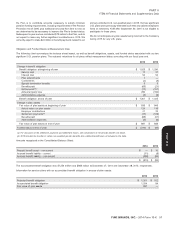
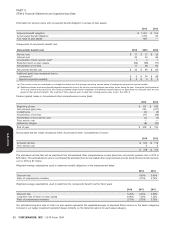
Expected benefits are estimated based on the same assumptions
Plan Assets used to measure our benefit obligation on the measurement date and
The fair values of our pension plan assets at December 27, 2014 and include benefits attributable to estimated future employee service.
December 28, 2013 by asset category and level within the fair value
hierarchy are as follows: International Pension Plans
2014 2013 We also sponsor various defined benefit plans covering certain of our
Level 2: non-U.S. employees, the most significant of which are in the UK.
Cash Equivalents(a) $5$5 During 2013, one of our UK plans was frozen such that existing
Equity Securities – U.S. Large cap(b) 298 329 participants can no longer earn future service credits. Our other UK
Equity Securities – U.S. Mid cap(b) 50 55 plan was previously frozen to future service credits in 2011.
Equity Securities – U.S. Small cap(b) 50 53 At the end of 2014 and 2013, the projected benefit obligations of these
Equity Securities – Non-U.S.(b) 91 110 U.K. plans totaled $231 million and $226 million, respectively and plan
Fixed Income Securities – U.S. assets totaled $288 million and $259 million, respectively. These
Corporate(b) 305 234 plans were both in a net overfunded position at the end of 2014 and
Fixed Income Securities – U.S. 2013 and related expense amounts recorded in each of 2014, 2013
Government and Government and 2012 were not significant.
Agencies(c) 178 129
Fixed Income Securities – Other(d) 11 15 The funding rules for our pension plans outside of the U.S. vary from
country to country and depend on many factors including discount
Total fair value of plan assets(e) $ 988 $ 930
rates, performance of plan assets, local laws and regulations. We do
(a) Short-term investments in money market funds not plan to make significant contributions to either of our UK plans in
(b) Securities held in common trusts 2015.
(c) Investments held directly by the Plan
(d) Includes securities held in common trusts and investments held directly by Retiree Medical Benefits
the Plan
(e) 2014 and 2013 both exclude net unsettled trades receivable of $3 million Our post-retirement plan provides health care benefits, principally to
U.S. salaried retirees and their dependents, and includes retiree
Our primary objectives regarding the investment strategy for the cost-sharing provisions. This plan was previously amended such that
Plan’s assets are to reduce interest rate and market risk and to any salaried employee hired or rehired by YUM after September 30,
provide adequate liquidity to meet immediate and future payment 2001 is not eligible to participate in this plan. Employees hired prior to
requirements. To achieve these objectives, we are using a September 30, 2001 are eligible for benefits if they meet age and
combination of active and passive investment strategies. Our equity service requirements and qualify for retirement benefits. We fund our
securities, currently targeted to be 50% of our investment mix, consist post-retirement plan as benefits are paid.
primarily of low-cost index funds focused on achieving long-term
capital appreciation. We diversify our equity risk by investing in At the end of 2014 and 2013, the accumulated post-retirement benefit
several different U.S. and foreign market index funds. Investing in obligation was $69 million and $70 million, respectively. An actuarial
these index funds provides us with the adequate liquidity required to gain of $2 million was recognized in Accumulated other
fund benefit payments and plan expenses. The fixed income asset comprehensive (income) loss at the end of both 2014 and 2013. The
allocation, currently targeted to be 50% of our mix, is actively net periodic benefit cost recorded was $5 million in both 2014 and
managed and consists of long-duration fixed income securities that 2013 and $6 million in 2012, the majority of which is interest cost on
help to reduce exposure to interest rate variation and to better the accumulated post-retirement benefit obligation. The weighted-
correlate asset maturities with obligations. The fair values of all average assumptions used to determine benefit obligations and net
pension plan assets are determined based on closing market prices or periodic benefit cost for the post-retirement medical plan are identical
net asset values. to those as shown for the U.S. pension plans. Our assumed heath
care cost trend rates for the following year as of 2014 and 2013 are
A mutual fund held as an investment by the Plan includes shares of 7.1% and 7.2%, respectively, with expected ultimate trend rates of
YUM common stock valued at $0.5 million at December 27, 2014 and 4.5% reached in 2028.
$0.2 million at December 28, 2013 (less than 1% of total plan assets in
each instance). There is a cap on our medical liability for certain retirees. The cap for
Medicare-eligible retirees was reached in 2000 and the cap for
non-Medicare eligible retirees was reached in 2014; with the cap, our
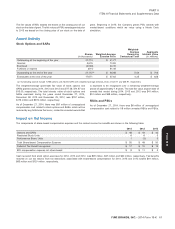
Benefit Payments
annual cost per retiree will not increase. A one-percentage-point
The benefits expected to be paid in each of the next five years and in increase or decrease in assumed health care cost trend rates would
the aggregate for the five years thereafter are set forth below: have less than a $1 million impact on total service and interest cost
and on the post-retirement benefit obligation. The benefits expected to
Year ended: be paid in each of the next five years are approximately $6 million and
in aggregate for the five years thereafter are $24 million.
2015 $ 72
2016 53
2017 51 Retiree Savings Plan
2018 55
2019 57 We sponsor a contributory plan to provide retirement benefits under
2020 – 2024 299 the provisions of Section 401(k) of the Internal Revenue Code (the
‘‘401(k) Plan’’) for eligible U.S. salaried and hourly employees.
Participants are able to elect to contribute up to 75% of eligible
YUM! BRANDS, INC. - 2014 Form 10-K 59
13MAR201516053226
Form 10-K