Pizza Hut 2014 Annual Report Download - page 110
Download and view the complete annual report
Please find page 110 of the 2014 Pizza Hut annual report below. You can navigate through the pages in the report by either clicking on the pages listed below, or by using the keyword search tool below to find specific information within the annual report.
13MAR201517272138
PART II
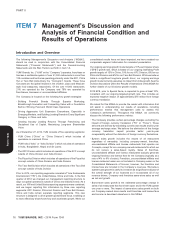
ITEM 7 Management’s Discussion and
Analysis of Financial Condition and
Results of Operations
Introduction and Overview
The following Management’s Discussion and Analysis (‘‘MD&A’’), consolidated results have not been impacted, we have restated our
should be read in conjunction with the Consolidated Financial comparable segment information for consistent presentation.
Statements (‘‘Financial Statements’’) and the Forward-Looking Our ongoing earnings growth model targets a 10% earnings per share
Statements and the Risk Factors set forth in Item 1A. (‘‘EPS’’) growth rate, which is based on our ongoing Operating Profit
YUM! Brands, Inc. (‘‘YUM’’ or the ‘‘Company’’) operates, franchises or growth targets of 15% in China, 10% for our KFC Division, 8% for our
licenses a worldwide system of over 41,000 restaurants in more than Pizza Hut Division and 6% for our Taco Bell Division. While we believe
125 countries and territories operating primarily under the KFC, Pizza India is a significant long-term growth driver, our ongoing earnings
Hut or Taco Bell (collectively the ‘‘Concepts’’) brands. These three growth model currently assumes no impact from India growth. See the
Concepts are the global leaders in the chicken, pizza and Mexican- Division discussions within the Results of Operations of this MD&A for
style food categories, respectively. Of the over 41,000 restaurants, further details of our Divisional growth models.
21% are operated by the Company and 79% are operated by 2015 EPS, prior to Special Items, is expected to grow at least 10%,
franchisees, licensees or unconsolidated affiliates. consistent with our ongoing targeted growth rate. This includes an
The Company is focused on the following key growth strategies: expected negative impact of approximately $75 million from foreign
currency translation.
Building Powerful Brands Through Superior Marketing,
Breakthrough Innovation and Compelling Value with a Foundation We intend for this MD&A to provide the reader with information that
Built on Winning Food and World Class Operations will assist in understanding our results of operations, including
performance metrics that management uses to assess the
Driving Aggressive Unit Expansion Everywhere, Especially in Company’s performance. Throughout this MD&A, we commonly
Emerging Markets, and Building Leading Brands in Every Significant discuss the following performance metrics:
Category in China and India
The Company provides certain percentage changes excluding the
Creating Industry Leading Returns Through Franchising and impact of foreign currency translation (‘‘FX’’ or ‘‘Forex’’). These
Disciplined Use of Capital, Maximizing Long-term Shareholder amounts are derived by translating current year results at prior year
Value average exchange rates. We believe the elimination of the foreign
currency translation impact provides better year-to-year
As of December 27, 2014, YUM consists of five operating segments:
comparability without the distortion of foreign currency fluctuations.
YUM China (‘‘China’’ or ‘‘China Division’’) which includes all
System sales growth includes the results of all restaurants
operations in mainland China
regardless of ownership, including company-owned, franchise,
YUM India (‘‘India’’ or ‘‘India Division’’) which includes all operations unconsolidated affiliate and license restaurants that operate our
in India, Bangladesh, Nepal and Sri Lanka Concepts, except for non-company-owned restaurants for which we
do not receive a sales-based royalty. Sales of franchise,
The KFC Division which includes all operations of the KFC concept unconsolidated affiliate and license restaurants typically generate
outside of China Division and India Division ongoing franchise and license fees for the Company (typically at a
The Pizza Hut Division which includes all operations of the Pizza Hut rate of 4% to 6% of sales). Franchise, unconsolidated affiliate and
concept outside of China Division and India Division license restaurant sales are not included in Company sales on the
Consolidated Statements of Income; however, the franchise and
The Taco Bell Division which includes all operations of the Taco Bell license fees are included in the Company’s revenues. We believe
concept outside of India Division system sales growth is useful to investors as a significant indicator of
the overall strength of our business as it incorporates all of our
Prior to 2014, our reporting segments consisted of Yum Restaurants
revenue drivers, Company and franchise same-store sales as well
International (‘‘YRI’’), the United States, China and India. In the first
as net unit growth.
quarter of 2014 we changed our management reporting structure to
align our global operations outside of China and India by brand. As a Same-store sales growth is the estimated percentage change in
result, our YRI and United States reporting segments were combined, sales of all restaurants that have been open and in the YUM system
and we began reporting this information by three new reporting one year or more. The impact of same-store sales growth on both
segments: KFC Division, Pizza Hut Division and Taco Bell Division. our Company-owned store results and Franchise and license fees
China and India remain separate reporting segments. This new and income is described elsewhere in this MD&A.
structure is designed to drive greater global brand focus, enabling us
to more effectively share know-how and accelerate growth. While our
16 YUM! BRANDS, INC. - 2014 Form 10-K
•
•
•
•
•
•
•
•
•
•
•
Form 10-K


