Pizza Hut 2014 Annual Report Download - page 72
Download and view the complete annual report
Please find page 72 of the 2014 Pizza Hut annual report below. You can navigate through the pages in the report by either clicking on the pages listed below, or by using the keyword search tool below to find specific information within the annual report.-
 1
1 -
2
-
3
-
4
-
5
-
6
-
7
-
8
-
9
-
10
-
11
-
12
-
13
-
14
-
15
-
16
-
17
-
18
-
19
-
20
-
21
-
22
-
23
-
24
-
25
-
26
-
27
-
28
-
29
-
30
-
31
-
32
-
33
-
34
-
35
-
36
-
37
-
38
-
39
-
40
-
41
-
42
-
43
-
44
-
45
-
46
-
47
-
48
-
49
-
50
-
51
-
52
-
53
-
54
-
55
-
56
-
57
-
58
-
59
-
60
-
61
-
 62
62 -
 63
63 -
 64
64 -
 65
65 -
 66
66 -
 67
67 -
 68
68 -
 69
69 -
 70
70 -
 71
71 -
 72
72 -
 73
73 -
 74
74 -
 75
75 -
 76
76 -
 77
77 -
 78
78 -
 79
79 -
 80
80 -
 81
81 -
 82
82 -
83
-
84
-
85
-
86
-
87
-
88
-
89
-
90
-
91
-
92
-
93
-
94
-
95
-
96
-
97
-
98
-
99
-
100
-
101
-
102
-
103
-
104
-
105
-
106
-
107
-
108
-
109
-
110
-
111
-
112
-
113
-
114
-
115
-
116
-
117
-
118
-
119
-
120
-
121
-
122
-
123
-
124
-
125
-
126
-
127
-
128
-
129
-
130
-
131
-
132
-
133
-
134
-
135
-
136
-
137
-
138
-
139
-
140
-
141
-
142
-
143
-
144
-
145
-
146
-
147
-
148
-
149
-
150
-
151
-
152
-
153
-
154
-
155
-
156
-
157
-
158
-
159
-
160
-
161
-
162
-
163
-
164
-
165
-
166
-
167
-
168
-
169
-
170
-
171
-
172
-
173
-
174
-
175
-
176
 |
 |

15MAR201511093851
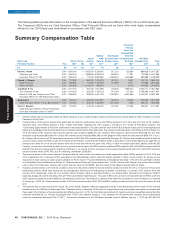
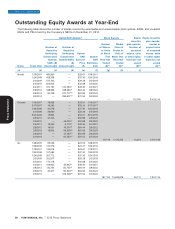
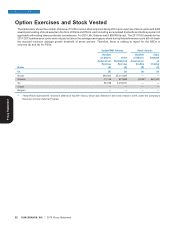
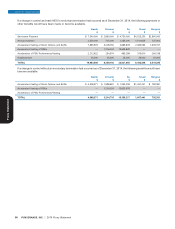
Outstanding Equity Awards at Year-End
The following table shows the number of shares covered by exercisable and unexercisable stock options, SARs, and unvested
RSUs and PSUs held by the Company’s NEOs on December 31, 2014.
Novak 1/19/2007 490,960 — $29.61 1/19/2017
1/24/2008 428,339 — $37.30 1/24/2018
2/5/2009 575,102 — $29.29 2/5/2019
2/5/2010 623,925 — $32.98 2/5/2020
2/4/2011 372,190 124,064(i) $49.30 2/4/2021
2/8/2012 188,664 188,664(ii) $64.44 2/8/2022
2/6/2013 90,239 270,717(iii) $62.93 2/6/2023
2/5/2014 — 299,607(iv) $70.54 2/5/2024
— — 115,760 8,433,116
Grismer 1/19/2007 19,938 — $29.61 1/19/2017
5/17/2007 16,262 — $33.20 5/17/2017
1/24/2008 20,079 — $37.30 1/24/2018
2/5/2009 33,830 — $29.29 2/5/2019
5/21/2009 15,853 — $33.21 5/21/2019
2/5/2010 34,424 — $32.98 2/5/2020
2/5/2010 — 43,030(v) $32.98 2/5/2020
2/4/2011 18,330 6,110(i) $49.30 2/4/2021
2/8/2012 16,551 16,551(ii) $64.44 2/8/2022
2/6/2013 18,942 56,828(iii) $62.93 2/6/2023
2/6/2013 — 45,462(vi) $62.93 2/6/2023
2/5/2014 — 84,583(iv) $70.54 2/5/2024
16,119 1,174,244 14,374 1,047,146
Su 1/28/2005 65,039 — $22.53 1/28/2015
1/26/2006 124,316 — $24.47 1/26/2016
1/19/2007 132,918 — $29.61 1/19/2017
1/24/2008 107,085 — $37.30 1/24/2018
1/24/2008 267,712 — $37.30 1/24/2018
2/5/2009 202,977 — $29.29 2/5/2019
2/5/2010 172,118 — $32.98 2/5/2020
2/4/2011 106,925 35,642(i) $49.30 2/4/2021
2/8/2012 82,754 82,755(ii) $64.44 2/8/2022
2/6/2013 30,307 90,924(iii) $62.93 2/6/2023
2/5/2014 — 109,339(iv) $70.54 2/5/2024
187,150 13,633,878 26,110 1,902,114
50 YUM! BRANDS, INC. 2015 Proxy Statement
Option/SAR Awards(1) Stock Awards Equity Equity incentive
incentive plan awards:
Number Market plan awards: market or
Number of Number of of Shares Value of Number of payout value
Securities Securities or Units Shares or unearned of unearned
Underlying Underlying Option/ of Stock Units of shares, units shares, units
Unexercised Unexercised SAR Option/ That Stock That or other rights or other rights
Options/ Options/SARs Exercise SAR Have Not Have Not that have not that have not
SARs (#) (#) Price Expiration Vested Vested vested vested
Name Grant Date Exercisable Unexercisable ($) Date (#)(2) ($)(3) (#)(4) ($)(3)
(a) (b) (c) (d) (e) (f) (g) (h) (i)
EXECUTIVE COMPENSATION
Proxy Statement