Pizza Hut 2014 Annual Report Download - page 117
Download and view the complete annual report
Please find page 117 of the 2014 Pizza Hut annual report below. You can navigate through the pages in the report by either clicking on the pages listed below, or by using the keyword search tool below to find specific information within the annual report.-
 1
1 -
2
-
3
-
4
-
5
-
6
-
7
-
8
-
9
-
10
-
11
-
12
-
13
-
14
-
15
-
16
-
17
-
18
-
19
-
20
-
21
-
22
-
23
-
24
-
25
-
26
-
27
-
28
-
29
-
30
-
31
-
32
-
33
-
34
-
35
-
36
-
37
-
38
-
39
-
40
-
41
-
42
-
43
-
44
-
45
-
46
-
47
-
48
-
49
-
50
-
51
-
52
-
53
-
54
-
55
-
56
-
57
-
58
-
59
-
60
-
61
-
62
-
63
-
64
-
65
-
66
-
67
-
68
-
69
-
70
-
71
-
72
-
73
-
74
-
75
-
76
-
77
-
78
-
79
-
80
-
81
-
82
-
83
-
84
-
85
-
86
-
87
-
88
-
89
-
90
-
91
-
92
-
93
-
94
-
95
-
96
-
97
-
98
-
99
-
100
-
101
-
102
-
103
-
104
-
105
-
106
-
 107
107 -
 108
108 -
 109
109 -
 110
110 -
 111
111 -
 112
112 -
 113
113 -
 114
114 -
 115
115 -
 116
116 -
 117
117 -
 118
118 -
 119
119 -
 120
120 -
 121
121 -
 122
122 -
 123
123 -
 124
124 -
 125
125 -
 126
126 -
 127
127 -
128
-
129
-
130
-
131
-
132
-
133
-
134
-
135
-
136
-
137
-
138
-
139
-
140
-
141
-
142
-
143
-
144
-
145
-
146
-
147
-
148
-
149
-
150
-
151
-
152
-
153
-
154
-
155
-
156
-
157
-
158
-
159
-
160
-
161
-
162
-
163
-
164
-
165
-
166
-
167
-
168
-
169
-
170
-
171
-
172
-
173
-
174
-
175
-
176
 |
 |

PART II
ITEM 7 Management’s Discussion and Analysis of Financial Condition and Results of Operations
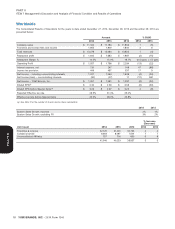
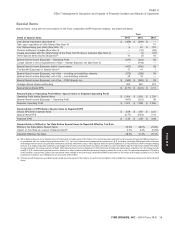
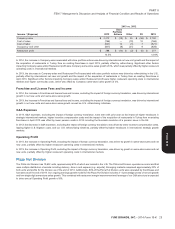
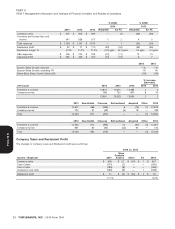
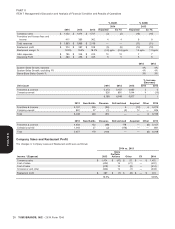
2013 vs. 2012
Store
Portfolio
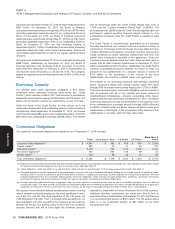
Income / (Expense) 2012 Actions Other FX 2013
Company sales $ 2,212 $ (19) $ 35 $ (36) $ 2,192
Cost of sales (766) — (15) 15 (766)
Cost of labor (541) 14 (1) 7 (521)
Occupancy and other (607) (9) (21) 9 (628)
Restaurant profit $ 298 $ (14) $ (2) $ (5) $ 277
13.5% 12.6%
In 2014, the increase in Company sales associated with store portfolio actions was driven by international net new unit growth and the impact of
the acquisition of restaurants in Turkey from an existing franchisee in April 2013, partially offset by refranchising. Significant other factors
impacting Company sales and/or Restaurant profit were Company same-store sales growth of 4%, which was partially offset by higher restaurant
operating costs in international markets.
In 2013, the decrease in Company sales and Restaurant Profit associated with store portfolio actions was driven by refranchising in the U.S.,
partially offset by international net new unit growth and the impact of the acquisition of restaurants in Turkey from an existing franchisee in
April 2013. Significant other factors impacting Company sales and/or Restaurant profit were higher restaurant operating costs in international
markets and higher commodity costs, which was offset by Company same-store sales growth of 2%.
Franchise and License Fees and Income
In 2014, the increase in Franchise and license fees and income, excluding the impact of foreign currency translation, was driven by international
growth in net new units and same-store sales growth.
In 2013, the increase in Franchise and license fees and income, excluding the impact of foreign currency translation, was driven by international
growth in net new units and same-store sales growth as well as U.S. refranchising initiatives.
G&A Expenses
In 2014, G&A expenses, excluding the impact of foreign currency translation, were even with prior year as the impact of higher headcount in
strategic international markets, higher incentive compensation costs and the impact of the acquisition of restaurants in Turkey from an existing
franchisee in April 2013 was offset by lower pension costs in 2014 including the favorable resolution of a pension issue in the UK.
In 2013, the decrease in G&A expenses, excluding the impact of foreign currency translation, was driven by lower incentive compensation costs,
lapping higher U.S. litigation costs, and our U.S. refranchising initiatives, partially offset by higher headcount in international strategic growth
markets.
Operating Profit
In 2014, the increase in Operating Profit, excluding the impact of foreign currency translation, was driven by growth in same-store sales and net
new units, partially offset by higher restaurant operating costs in international markets.
In 2013, the increase in Operating Profit, excluding the impact of foreign currency translation, was driven by growth in same-store sales and net
new units, partially offset by higher restaurant operating costs in international markets.
Pizza Hut Division
The Pizza Hut Division has 13,602 units, approximately 60% of which are located in the U.S. The Pizza Hut Division operates as one brand that
uses multiple distribution channels including delivery, dine-in and express (e.g. airports). Emerging markets comprised approximately 20% of
both units and profits for the Division as of the end of 2014. Additionally, 94% of the Pizza Hut Division units were operated by franchisees and
licensees as of the end of 2014. Our ongoing earnings growth model for the Pizza Hut Division includes 3 - 4 percentage points of net unit growth
and low-single-digit same-store sales growth. This combined with restaurant margin improvement and leverage of our G&A structure is expected
to drive annual Operating Profit growth of 8%.
YUM! BRANDS, INC. - 2014 Form 10-K 23
13MAR201516053226
Form 10-K