Pizza Hut 2014 Annual Report Download - page 111
Download and view the complete annual report
Please find page 111 of the 2014 Pizza Hut annual report below. You can navigate through the pages in the report by either clicking on the pages listed below, or by using the keyword search tool below to find specific information within the annual report.-
 1
1 -
2
-
3
-
4
-
5
-
6
-
7
-
8
-
9
-
10
-
11
-
12
-
13
-
14
-
15
-
16
-
17
-
18
-
19
-
20
-
21
-
22
-
23
-
24
-
25
-
26
-
27
-
28
-
29
-
30
-
31
-
32
-
33
-
34
-
35
-
36
-
37
-
38
-
39
-
40
-
41
-
42
-
43
-
44
-
45
-
46
-
47
-
48
-
49
-
50
-
51
-
52
-
53
-
54
-
55
-
56
-
57
-
58
-
59
-
60
-
61
-
62
-
63
-
64
-
65
-
66
-
67
-
68
-
69
-
70
-
71
-
72
-
73
-
74
-
75
-
76
-
77
-
78
-
79
-
80
-
81
-
82
-
83
-
84
-
85
-
86
-
87
-
88
-
89
-
90
-
91
-
92
-
93
-
94
-
95
-
96
-
97
-
98
-
99
-
100
-
 101
101 -
 102
102 -
 103
103 -
 104
104 -
 105
105 -
 106
106 -
 107
107 -
 108
108 -
 109
109 -
 110
110 -
 111
111 -
 112
112 -
 113
113 -
 114
114 -
 115
115 -
 116
116 -
 117
117 -
 118
118 -
 119
119 -
 120
120 -
 121
121 -
122
-
123
-
124
-
125
-
126
-
127
-
128
-
129
-
130
-
131
-
132
-
133
-
134
-
135
-
136
-
137
-
138
-
139
-
140
-
141
-
142
-
143
-
144
-
145
-
146
-
147
-
148
-
149
-
150
-
151
-
152
-
153
-
154
-
155
-
156
-
157
-
158
-
159
-
160
-
161
-
162
-
163
-
164
-
165
-
166
-
167
-
168
-
169
-
170
-
171
-
172
-
173
-
174
-
175
-
176
 |
 |

PART II
ITEM 7 Management’s Discussion and Analysis of Financial Condition and Results of Operations
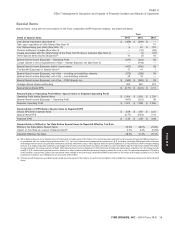
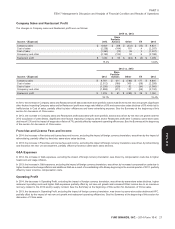
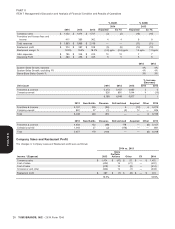
Company Restaurant profit (‘‘Restaurant profit’’) is defined as performance measure of results of operations for the purpose of
Company sales less expenses incurred directly by our Company- evaluating performance internally and Special Items are not
owned restaurants in generating Company sales. Company included in any of our segment results. This non-GAAP
restaurant margin as a percentage of sales is defined as Restaurant measurement is not intended to replace the presentation of our
profit divided by Company sales. Within the Company Sales and financial results in accordance with GAAP. Rather, the Company
Restaurant Profit analysis, Store Portfolio Actions represent the net believes that the presentation of earnings before Special Items
impact of new unit openings, acquisitions, refranchising and store provides additional information to investors to facilitate the
closures, and Other primarily represents the impact of same-store comparison of past and present operations, excluding those items
sales as well as the impact of changes in costs such as inflation/ that the Company does not believe are indicative of our ongoing
deflation. operations due to their size and/or nature.
In addition to the results provided in accordance with U.S. Generally All Note references herein refer to the Notes to the Financial
Accepted Accounting Principles (‘‘GAAP’’) throughout this MD&A, Statements. Tabular amounts are displayed in millions of U.S. dollars
the Company provides non-GAAP measurements which present except per share and unit count amounts, or as otherwise specifically
operating results on a basis before items that we have deemed identified. Percentages may not recompute due to rounding.
Special. The Company uses earnings before Special Items as a key
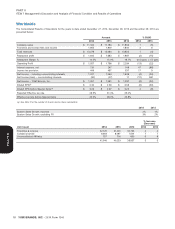
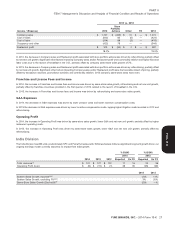
Results of Operations
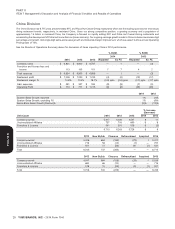
profits due to intense media surrounding an investigation by the SFDA
Summary into our poultry supply management that began in December 2012,
All comparisons within this summary are versus the same period a coupled with additional intense media in April 2013 surrounding Avian
year ago and exclude the impact of Special Items. All system sales Flu in China.
growth and Operating Profit comparisons exclude the impact of As a result of two supplier incidents impacting KFC China sales in a
foreign currency. relatively short period of time, the recovery at KFC China has been
2014 diluted EPS increased by 4% to $3.09 per share as our China slower than expected with same-store sales declining 18% in the
Division, which is our largest profit contributor, had its sales and profits fourth quarter of 2014. Our Pizza Hut business in China, which was
significantly impacted by adverse publicity in July surrounding only impacted by the 2014 supplier incident, is recovering more
improper food handling practices by a former supplier. quickly. China Division same-store sales and Operating Profit
declined 5% and 8%, respectively, for the full year 2014.
Specifically, on July 20, 2014, an undercover report was televised in
China depicting improper food handling practices by supplier Also during 2014:
Shanghai Husi, a division of OSI, which is a large, global supplier to KFC Division system sales and Operating Profit increased by 6%
many in the restaurant industry. This triggered extensive news and 13%, respectively. Same store sales grew 3% and the Division
coverage in China that shook consumer confidence and impacted opened 666 new international units.
brand usage. Subsequently, the Shanghai FDA (SFDA) launched an
investigation into this matter, alleging illegal activity by OSI. Upon Pizza Hut Division grew system sales by 1% and Operating Profit
learning of these events we terminated our relationship with OSI declined 13%. Same-store sales declined 1% and the Division
globally with minimal disruption to our menu offerings in China. Even opened 465 new international units.
though OSI was a minor supplier, sales at KFC and Pizza Hut were
Taco Bell Division system sales and Operating Profit increased by
disproportionately impacted given our category-leading positions.
4% and 5%, respectively. Same-store sales increased 3% and the
Since July 21st, China Division has experienced a significant, negative
Division opened 236 new units.
impact to sales and profits at both KFC and Pizza Hut.
Foreign currency translation negatively impacted Operating Profit by
Prior to that incident, YUM experienced a strong first half of the year
$27 million.
with China Division Operating Profit increasing 113% and EPS
increasing 27% through the first two quarters of 2014. At that point the Our effective tax rate decreased from 28.0% in 2013 to 25.5% in
Company believed it was well on its way to recovering from a 9% EPS 2014.
decline in 2013, which was driven by declines in KFC China sales and
YUM! BRANDS, INC. - 2014 Form 10-K 17
•
•
•
•
•
•
•
13MAR201516053226
Form 10-K