Pizza Hut 2014 Annual Report Download - page 149
Download and view the complete annual report
Please find page 149 of the 2014 Pizza Hut annual report below. You can navigate through the pages in the report by either clicking on the pages listed below, or by using the keyword search tool below to find specific information within the annual report.-
 1
1 -
2
-
3
-
4
-
5
-
6
-
7
-
8
-
9
-
10
-
11
-
12
-
13
-
14
-
15
-
16
-
17
-
18
-
19
-
20
-
21
-
22
-
23
-
24
-
25
-
26
-
27
-
28
-
29
-
30
-
31
-
32
-
33
-
34
-
35
-
36
-
37
-
38
-
39
-
40
-
41
-
42
-
43
-
44
-
45
-
46
-
47
-
48
-
49
-
50
-
51
-
52
-
53
-
54
-
55
-
56
-
57
-
58
-
59
-
60
-
61
-
62
-
63
-
64
-
65
-
66
-
67
-
68
-
69
-
70
-
71
-
72
-
73
-
74
-
75
-
76
-
77
-
78
-
79
-
80
-
81
-
82
-
83
-
84
-
85
-
86
-
87
-
88
-
89
-
90
-
91
-
92
-
93
-
94
-
95
-
96
-
97
-
98
-
99
-
100
-
101
-
102
-
103
-
104
-
105
-
106
-
107
-
108
-
109
-
110
-
111
-
112
-
113
-
114
-
115
-
116
-
117
-
118
-
119
-
120
-
121
-
122
-
123
-
124
-
125
-
126
-
127
-
128
-
129
-
130
-
131
-
132
-
133
-
134
-
135
-
136
-
137
-
138
-
 139
139 -
 140
140 -
 141
141 -
 142
142 -
 143
143 -
 144
144 -
 145
145 -
 146
146 -
 147
147 -
 148
148 -
 149
149 -
 150
150 -
 151
151 -
 152
152 -
 153
153 -
 154
154 -
 155
155 -
 156
156 -
 157
157 -
 158
158 -
 159
159 -
160
-
161
-
162
-
163
-
164
-
165
-
166
-
167
-
168
-
169
-
170
-
171
-
172
-
173
-
174
-
175
-
176
 |
 |

PART II
ITEM 8 Financial Statements and Supplementary Data
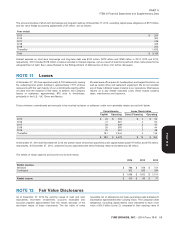
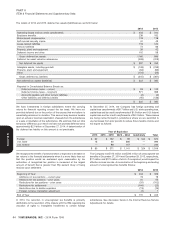
The annual maturities of short-term borrowings and long-term debt as of December 27, 2014, excluding capital lease obligations of $175 million
and fair value hedge accounting adjustments of $7 million, are as follows:
Year ended:
2015 $ 250
2016 300
2017 416
2018 325
2019 250
Thereafter 1,625
Total $ 3,166
Interest expense on short-term borrowings and long-term debt was $152 million, $270 million and $169 million in 2014, 2013 and 2012,
respectively. 2013 included $118 million in losses recorded in Interest expense, net as a result of premiums paid and other costs related to the
extinguishment of debt. See Losses Related to the Extinguishment of Debt section of Note 4 for further discussion.
Leases
At December 27, 2014 we operated nearly 8,700 restaurants, leasing We also lease office space for headquarters and support functions, as
the underlying land and/or building in approximately 7,775 of those well as certain office and restaurant equipment. We do not consider
restaurants with the vast majority of our commitments expiring within any of these individual leases material to our operations. Most leases
20 years from the inception of the lease. In addition, the Company require us to pay related executory costs, which include property
leases or subleases approximately 875 units to franchisees, taxes, maintenance and insurance.
principally in the U.S., UK, China and Mexico.
Future minimum commitments and amounts to be received as lessor or sublessor under non-cancelable leases are set forth below:
Commitments Lease Receivables
Capital Operating Direct Financing Operating
2015 $20 $ 709 $2 $56
2016 21 661 2 52
2017 20 609 2 47
2018 20 555 2 44
2019 20 501 1 38
Thereafter 181 2,444 4 116
$ 282 $ 5,479 $ 13 $ 353
At December 27, 2014 and December 28, 2013, the present value of minimum payments under capital leases was $175 million and $172 million,
respectively. At December 27, 2014, unearned income associated with direct financing lease receivables was $3 million.
The details of rental expense and income are set forth below:
2014 2013 2012
Rental expense
Minimum $ 766 $ 759 $ 721
Contingent 302 293 290
$ 1,068 $ 1,052 $ 1,011
Rental income $ 103 $ 94 $ 77
Fair Value Disclosures
As of December 27, 2014 the carrying values of cash and cash receivable net of allowances and lease guarantees less subsequent
equivalents, short-term investments, accounts receivable and amortization approximates their carrying value. The Company’s debt
accounts payable approximated their fair values because of the obligations, excluding capital leases, were estimated to have a fair
short-term nature of these instruments. The fair value of notes value of $3.4 billion (Level 2), compared to their carrying value of
YUM! BRANDS, INC. - 2014 Form 10-K 55
NOTE 11
NOTE 12
13MAR201516053226
Form 10-K