Pizza Hut 2014 Annual Report Download - page 122
Download and view the complete annual report
Please find page 122 of the 2014 Pizza Hut annual report below. You can navigate through the pages in the report by either clicking on the pages listed below, or by using the keyword search tool below to find specific information within the annual report.-
 1
1 -
2
-
3
-
4
-
5
-
6
-
7
-
8
-
9
-
10
-
11
-
12
-
13
-
14
-
15
-
16
-
17
-
18
-
19
-
20
-
21
-
22
-
23
-
24
-
25
-
26
-
27
-
28
-
29
-
30
-
31
-
32
-
33
-
34
-
35
-
36
-
37
-
38
-
39
-
40
-
41
-
42
-
43
-
44
-
45
-
46
-
47
-
48
-
49
-
50
-
51
-
52
-
53
-
54
-
55
-
56
-
57
-
58
-
59
-
60
-
61
-
62
-
63
-
64
-
65
-
66
-
67
-
68
-
69
-
70
-
71
-
72
-
73
-
74
-
75
-
76
-
77
-
78
-
79
-
80
-
81
-
82
-
83
-
84
-
85
-
86
-
87
-
88
-
89
-
90
-
91
-
92
-
93
-
94
-
95
-
96
-
97
-
98
-
99
-
100
-
101
-
102
-
103
-
104
-
105
-
106
-
107
-
108
-
109
-
110
-
111
-
 112
112 -
 113
113 -
 114
114 -
 115
115 -
 116
116 -
 117
117 -
 118
118 -
 119
119 -
 120
120 -
 121
121 -
 122
122 -
 123
123 -
 124
124 -
 125
125 -
 126
126 -
 127
127 -
 128
128 -
 129
129 -
 130
130 -
 131
131 -
 132
132 -
133
-
134
-
135
-
136
-
137
-
138
-
139
-
140
-
141
-
142
-
143
-
144
-
145
-
146
-
147
-
148
-
149
-
150
-
151
-
152
-
153
-
154
-
155
-
156
-
157
-
158
-
159
-
160
-
161
-
162
-
163
-
164
-
165
-
166
-
167
-
168
-
169
-
170
-
171
-
172
-
173
-
174
-
175
-
176
 |
 |

13MAR201517272138
PART II
ITEM 7 Management’s Discussion and Analysis of Financial Condition and Results of Operations
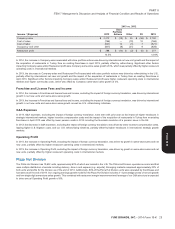
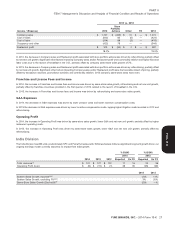
% Increase
(Decrease)
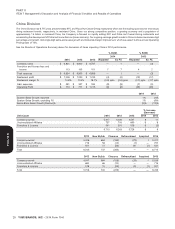
Unit Count 2014 2013 2012 2014 2013
Franchise & License 623 514 442 21 16
Company-owned 210 191 120 10 59
833 705 562 18 25
2013 New Builds Closures Refranchised Acquired 2014
Franchise & License 514 110 (21) 20 — 623
Company-owned 191 46 (7) (20) — 210
Total 705 156 (28) — — 833
2012 New Builds Closures Refranchised Acquired 2013
Franchise & License 442 89 (11) — (6) 514
Company-owned 120 68 (3) — 6 191
Total 562 157 (14) — — 705
(a) Effective the beginning of 2014, results from our 28 Mauritius stores are included in KFC and Pizza Hut Divisions as applicable. Prior year units have been
adjusted for comparability while division System Sales Growth, Total Revenues and Operating Profit (loss) have not been restated due to the immaterial dollar
impact of this change. While there was no impact to our consolidated results, this change negatively impacted India’s 2014 System Sales Growth, reported and
excluding FX, by 10% and 11%, respectively. This change negatively impacted India’s 2014 Total revenues by 2% and Operating Profit (loss) by $1 million.
(b) At the beginning of fiscal 2013, we eliminated the period lag that was previously used to facilitate the reporting of our India Division’s results. Accordingly, the India
Division’s 2013 results include the months of January through December 2013. Due to the immateriality of the India Division’s results we did not restate the prior
year’s operating results for the elimination of this period lag. Therefore, the 2012 results continue to include the months of December 2011 through November
2012. Additionally, the table above compares these months. If we had compared like months in 2013 to 2012, India Division system sales, excluding the impact of
foreign currency translation, would have been 2% higher and same-store sales would have been 1% lower versus what is shown above, respectively, for the year
ended December 28, 2013.
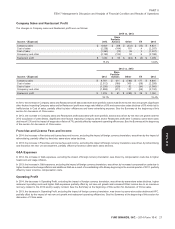
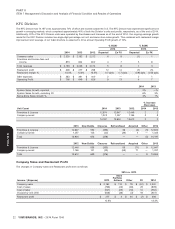
Corporate & Unallocated
% B/(W)
Income / (Expense) 2014 2013 2012 2014 2013
Corporate G&A $ (189) $ (207) $ (271) 9 24
Unallocated closures and impairments (463) (295) $ — (57) NM
Unallocated Refranchising gain (loss) 33 100 78 (67) 29
Other unallocated (22) (6) 92 (78) NM
Interest expense, net (130) (247) (149) 47 (66)
Income tax provision (406) (487) (537) 17 9
Effective tax rate 28.5% 31.4% 25.0% 2.9 ppts. (6.4) ppts.
Corporate G&A
In 2014, the decrease in Corporate G&A was driven by lower pension costs, including lapping higher pension settlement charges, partially offset
by higher legal and professional fees.
In 2013, the decrease in Corporate G&A was driven by lower pension costs, including lapping higher pension settlement charges, and lower
incentive compensation costs, partially offset by higher legal and professional fees.
Unallocated Closures and Impairments
In 2014 and 2013, Unallocated closures and impairments represent Little Sheep impairment charges. See Note 4.
Unallocated Refranchising Gain (Loss)
Unallocated Refranchising gain (loss) in 2014, 2013 and 2012 is discussed in Note 4.
Other Unallocated
In 2014, Other unallocated includes higher foreign exchange losses.
In 2012, Other unallocated includes a non-cash gain of $74 million related to our acquisition of Little Sheep in 2012.
28 YUM! BRANDS, INC. - 2014 Form 10-K
Form 10-K