Pizza Hut 2014 Annual Report Download - page 107
Download and view the complete annual report
Please find page 107 of the 2014 Pizza Hut annual report below. You can navigate through the pages in the report by either clicking on the pages listed below, or by using the keyword search tool below to find specific information within the annual report.-
 1
1 -
2
-
3
-
4
-
5
-
6
-
7
-
8
-
9
-
10
-
11
-
12
-
13
-
14
-
15
-
16
-
17
-
18
-
19
-
20
-
21
-
22
-
23
-
24
-
25
-
26
-
27
-
28
-
29
-
30
-
31
-
32
-
33
-
34
-
35
-
36
-
37
-
38
-
39
-
40
-
41
-
42
-
43
-
44
-
45
-
46
-
47
-
48
-
49
-
50
-
51
-
52
-
53
-
54
-
55
-
56
-
57
-
58
-
59
-
60
-
61
-
62
-
63
-
64
-
65
-
66
-
67
-
68
-
69
-
70
-
71
-
72
-
73
-
74
-
75
-
76
-
77
-
78
-
79
-
80
-
81
-
82
-
83
-
84
-
85
-
86
-
87
-
88
-
89
-
90
-
91
-
92
-
93
-
94
-
95
-
96
-
 97
97 -
 98
98 -
 99
99 -
 100
100 -
 101
101 -
 102
102 -
 103
103 -
 104
104 -
 105
105 -
 106
106 -
 107
107 -
 108
108 -
 109
109 -
 110
110 -
 111
111 -
 112
112 -
 113
113 -
 114
114 -
 115
115 -
 116
116 -
 117
117 -
118
-
119
-
120
-
121
-
122
-
123
-
124
-
125
-
126
-
127
-
128
-
129
-
130
-
131
-
132
-
133
-
134
-
135
-
136
-
137
-
138
-
139
-
140
-
141
-
142
-
143
-
144
-
145
-
146
-
147
-
148
-
149
-
150
-
151
-
152
-
153
-
154
-
155
-
156
-
157
-
158
-
159
-
160
-
161
-
162
-
163
-
164
-
165
-
166
-
167
-
168
-
169
-
170
-
171
-
172
-
173
-
174
-
175
-
176
 |
 |
20FEB201502140986
PART II
ITEM 5 Market for the Registrant’s Common Stock, Related Stockholder Matters and Issuer Purchases of Equity Securities
Issuer Purchases of Equity Securities
The following table provides information as of December 27, 2014 with respect to shares of Common Stock repurchased by the Company during
the quarter then ended:
Total number
of shares Total number of shares purchased as Approximate dollar value of shares
purchased Average price part of publicly announced plans or that may yet be purchased under
Fiscal Periods (thousands) paid per share programs (thousands) the plans or programs (millions)
Period 10 — $ — — $ 443
9/7/14 - 10/4/14
Period 11 1,836 $ 68.53 1,836 $ 317
10/5/14 - 11/1/14
Period 12 871 $ 73.73 871 $ 1,253
11/2/14 - 11/29/14
Period 13 1,689 $ 71.02 1,689 $ 1,133
11/30/14 - 12/27/14
Total 4,396 $ 70.52 4,396 $ 1,133
On November 22, 2013, our Board of Directors authorized share share repurchases through May 2016 of up to $1 billion (excluding
repurchases through May 2015 of up to $750 million (excluding applicable transaction fees) of our outstanding Common Stock. As of
applicable transaction fees) of our outstanding Common Stock. On December 27, 2014, we have remaining capacity to repurchase up to
November 20, 2014, our Board of Directors authorized additional $1.1 billion of Common Stock under these authorizations.
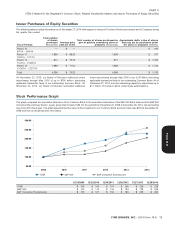
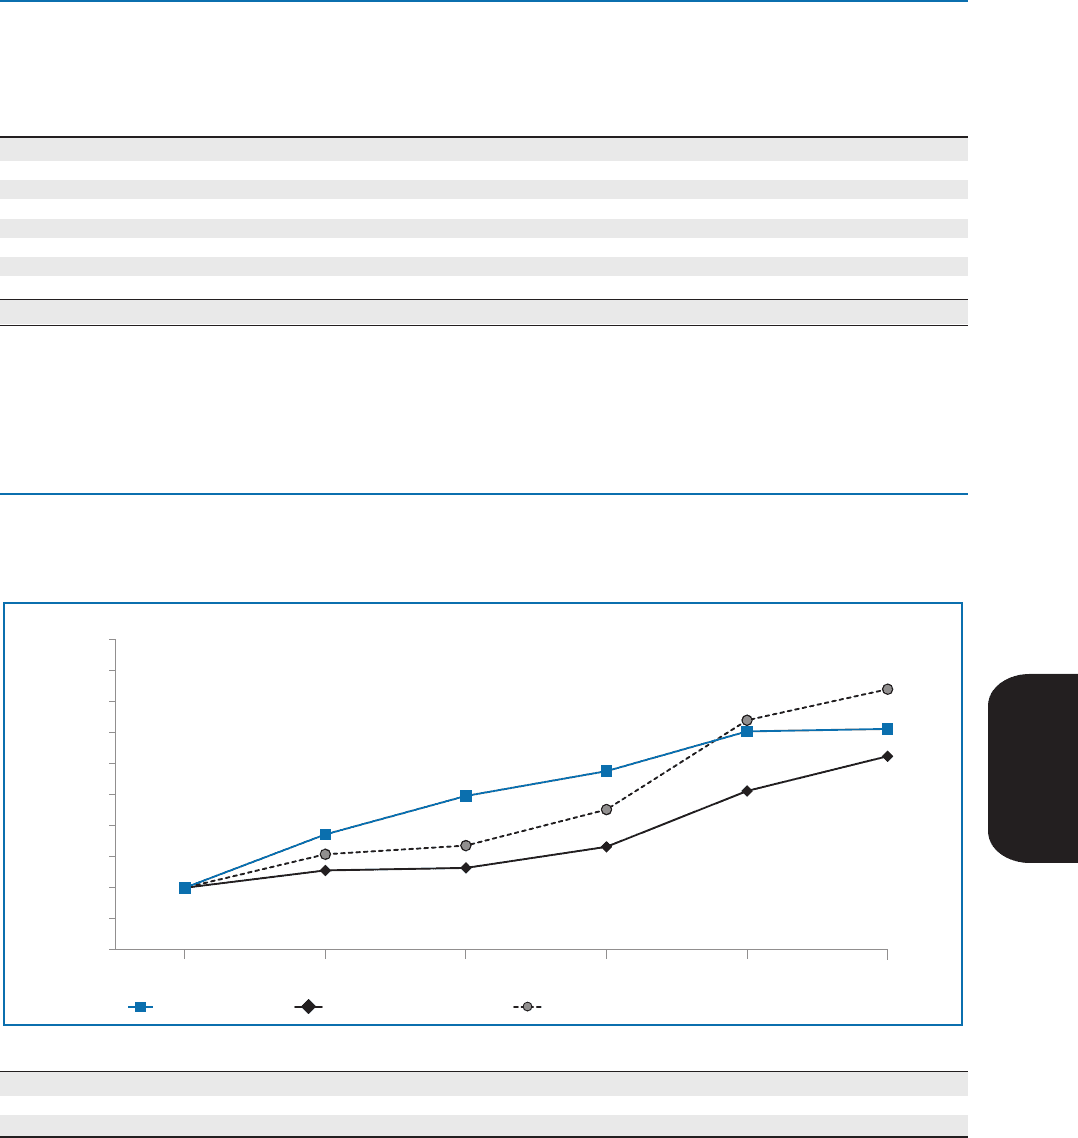
Stock Performance Graph
This graph compares the cumulative total return of our Common Stock to the cumulative total return of the S&P 500 Stock Index and the S&P 500
Consumer Discretionary Sector, a peer group that includes YUM, for the period from December 24, 2009 to December 26, 2014, the last trading
day of our 2014 fiscal year. The graph assumes that the value of the investment in our Common Stock and each index was $100 at December 24,
2009 and that all dividends were reinvested.
2009 201220112010 2013 2014
50.00
150.00
200.00
100.00
250.00
300.00
S&P Consumer Discretionary
YUM! S&P 500
12/24/2009 12/23/2010 12/30/2011 12/28/2012 12/27/2013 12/26/2014
YUM! $ 100 $ 143 $ 174 $ 194 $ 226 $ 228
S&P 500 $ 100 $ 114 $ 116 $ 133 $ 178 $ 206
S&P Consumer Discretionary $ 100 $ 127 $ 134 $ 163 $ 235 $ 260
YUM! BRANDS, INC. - 2014 Form 10-K 13
13MAR201516053226
Form 10-K