Pizza Hut 2014 Annual Report Download - page 55
Download and view the complete annual report
Please find page 55 of the 2014 Pizza Hut annual report below. You can navigate through the pages in the report by either clicking on the pages listed below, or by using the keyword search tool below to find specific information within the annual report.-
 1
1 -
2
-
3
-
4
-
5
-
6
-
7
-
8
-
9
-
10
-
11
-
12
-
13
-
14
-
15
-
16
-
17
-
18
-
19
-
20
-
21
-
22
-
23
-
24
-
25
-
26
-
27
-
28
-
29
-
30
-
31
-
32
-
33
-
34
-
35
-
36
-
37
-
38
-
39
-
40
-
41
-
42
-
43
-
44
-
 45
45 -
 46
46 -
 47
47 -
 48
48 -
 49
49 -
 50
50 -
 51
51 -
 52
52 -
 53
53 -
 54
54 -
 55
55 -
 56
56 -
 57
57 -
 58
58 -
 59
59 -
 60
60 -
 61
61 -
 62
62 -
 63
63 -
 64
64 -
 65
65 -
66
-
67
-
68
-
69
-
70
-
71
-
72
-
73
-
74
-
75
-
76
-
77
-
78
-
79
-
80
-
81
-
82
-
83
-
84
-
85
-
86
-
87
-
88
-
89
-
90
-
91
-
92
-
93
-
94
-
95
-
96
-
97
-
98
-
99
-
100
-
101
-
102
-
103
-
104
-
105
-
106
-
107
-
108
-
109
-
110
-
111
-
112
-
113
-
114
-
115
-
116
-
117
-
118
-
119
-
120
-
121
-
122
-
123
-
124
-
125
-
126
-
127
-
128
-
129
-
130
-
131
-
132
-
133
-
134
-
135
-
136
-
137
-
138
-
139
-
140
-
141
-
142
-
143
-
144
-
145
-
146
-
147
-
148
-
149
-
150
-
151
-
152
-
153
-
154
-
155
-
156
-
157
-
158
-
159
-
160
-
161
-
162
-
163
-
164
-
165
-
166
-
167
-
168
-
169
-
170
-
171
-
172
-
173
-
174
-
175
-
176
 |
 |

12MAR201503111646
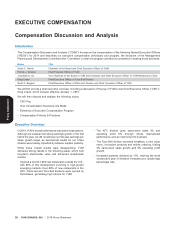
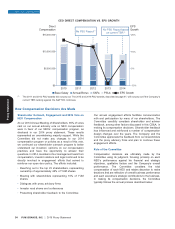
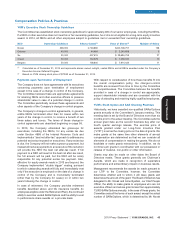
Chief Executive Officer Pay For 2014
.................................................................................................................................................................................................................................................................................................................................................................................
Our compensation program is designed to support our long- that our CEO’s target cash compensation, consisting of base
term Company growth model, while holding our executives salary and target bonus, was competitive compared to our
accountable to achieve key annual results year after year. Executive Peer Group and did not increase these elements. In
Our CEO is compensated in accordance with this long-term, regards to actual cash compensation for 2014, our CEO’s pay
pay-for-performance perspective and, as discussed on decreased by 18% compared to the prior year, due to a 45%
page 29, the Committee set 89% of Mr. Novak’s 2014 target decline in annual bonus. His annual bonus reflects below
pay at risk. target performance. As demonstrated below and on page 34,
our CEO’s cash compensation correlates with earnings per
Every January, the Committee makes decisions about the share growth, which is our primary business performance
CEO’s target compensation based on performance and metric.
market competitiveness. For 2014, the Committee determined
CEO CASH COMPENSATION VS. EPS GROWTH
$8,000,000
Cash
Compensation
$6,000,000
$4,000,000
$2,000,000
$0
20132012 201420112010
EPS
Growth
Base Salary Annual Bonus EPS Growth
-10%
10%
0%
20%
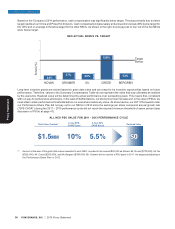
The Committee did not make any changes to Mr. Novak’s target direct compensation for 2014. Mr. Novak’s actual direct
compensation, comprised of base salary, bonus paid and annual long-term incentive award value remained relatively flat from
2010 – 2012 but decreased by 26% in 2013 and decreased another percentage point in 2014 as a result of his reduced annual
bonus. Although not included in the calculation of 2014 actual direct compensation, our CEO’s PSU award was not paid out since
the average earnings per share during the 2011 – 2013 performance cycle did not reach the required minimum average growth
threshold of seven percent. Consequently, Mr. Novak realized no value for the award which had a grant date value of $773,000
and was included in the calculation of his actual direct compensation for 2011 (shown below). Further, our CEO’s SARs will only
provide value to him if shareholders receive value through stock price appreciation. As demonstrated on page 34, our CEO’s
actual direct compensation, like cash compensation, tracks earnings per share growth.
2015 Proxy Statement YUM! BRANDS, INC. 33
EXECUTIVE COMPENSATION
Proxy Statement