Pizza Hut 2014 Annual Report Download - page 68
Download and view the complete annual report
Please find page 68 of the 2014 Pizza Hut annual report below. You can navigate through the pages in the report by either clicking on the pages listed below, or by using the keyword search tool below to find specific information within the annual report.-
 1
1 -
2
-
3
-
4
-
5
-
6
-
7
-
8
-
9
-
10
-
11
-
12
-
13
-
14
-
15
-
16
-
17
-
18
-
19
-
20
-
21
-
22
-
23
-
24
-
25
-
26
-
27
-
28
-
29
-
30
-
31
-
32
-
33
-
34
-
35
-
36
-
37
-
38
-
39
-
40
-
41
-
42
-
43
-
44
-
45
-
46
-
47
-
48
-
49
-
50
-
51
-
52
-
53
-
54
-
55
-
56
-
57
-
 58
58 -
 59
59 -
 60
60 -
 61
61 -
 62
62 -
 63
63 -
 64
64 -
 65
65 -
 66
66 -
 67
67 -
 68
68 -
 69
69 -
 70
70 -
 71
71 -
 72
72 -
 73
73 -
 74
74 -
 75
75 -
 76
76 -
 77
77 -
 78
78 -
79
-
80
-
81
-
82
-
83
-
84
-
85
-
86
-
87
-
88
-
89
-
90
-
91
-
92
-
93
-
94
-
95
-
96
-
97
-
98
-
99
-
100
-
101
-
102
-
103
-
104
-
105
-
106
-
107
-
108
-
109
-
110
-
111
-
112
-
113
-
114
-
115
-
116
-
117
-
118
-
119
-
120
-
121
-
122
-
123
-
124
-
125
-
126
-
127
-
128
-
129
-
130
-
131
-
132
-
133
-
134
-
135
-
136
-
137
-
138
-
139
-
140
-
141
-
142
-
143
-
144
-
145
-
146
-
147
-
148
-
149
-
150
-
151
-
152
-
153
-
154
-
155
-
156
-
157
-
158
-
159
-
160
-
161
-
162
-
163
-
164
-
165
-
166
-
167
-
168
-
169
-
170
-
171
-
172
-
173
-
174
-
175
-
176
 |
 |

15MAR201511093851
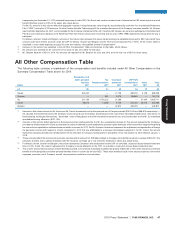
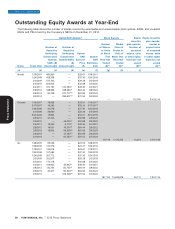
The following tables provide information on the compensation of the Named Executive Officers (‘‘NEOs’’) for our 2014 fiscal year.
The Company’s NEOs are our Chief Executive Officer, Chief Financial Officer and our three other most highly compensated
officers for our 2014 fiscal year determined in accordance with SEC rules.
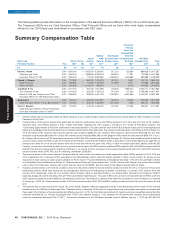
Summary Compensation Table
David C. Novak 2014 1,450,000 — 1,925,037 5,228,142 512,720 202,360 689,028 10,007,287
Chairman and Chief 2013 1,450,000 — 1,568,655 5,255,519 939,600 17,351 776,268 10,007,393
Executive Officer of YUM 2012 1,450,000 — 773,022 5,625,960 4,584,320 1,345,665 389,388 14,168,355
Patrick J. Grismer 2014 707,500 — 350,019 1,475,973 267,410 9,087 142,114 2,952,103
Chief Financial 2013 638,462 — 114,098 1,765,138 277,875 3,977 179,480 2,979,030
Officer of YUM 2012 500,308 — 1,014,347 493,551 — 6,115 104,652 2,118,973
Jing-Shyh S. Su 2014 1,100,000 — 450,045 1,907,966 378,235 1,956,023 5,035,711 10,827,980
Vice Chairman of the 2013 1,100,000 — 342,294 1,765,123 614,790 727,430 5,768,264 10,317,901
Board of YUM and Chairman and Chief 2012 1,088,462 — 385,029 2,467,739 2,039,813 5,537,865 5,042,547 16,561,455
Executive Officer of YUM Restaurants China
Greg Creed 2014 750,000 — 325,048 2,561,957 945,750 45,680 345,068 4,973,503
Chief Executive Officer of Taco Bell Division(7) 2013 750,000 — 203,735 1,323,839 1,511,625 7,348 238,737 4,035,284
Scott O. Bergren 2014 725,000 — 275,035 2,333,972 241,425 127,083 428,872 4,131,387
Chief Executive Officer of Pizza Hut Division
and Chief Innovation Officer of YUM(8)
(1) Amounts shown are not reduced to reflect the NEOs’ elections, if any, to defer receipt of salary into the Executive Income Deferral (‘‘EID’’) Program or into the
Company’s 401(k) Plan.
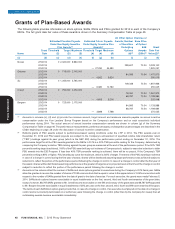
(2) Amounts shown in this column represent the grant date fair values for performance share units (PSUs) granted in 2014, 2013 and 2012 and, for Mr. Grismer,
restricted stock units (RSUs) granted in 2012. Further information regarding the 2014 awards is included in the ‘‘Grants of Plan-Based Awards’’ and
‘‘Outstanding Equity Awards at Year-End’’ tables later in this proxy statement. The grant date fair value of the PSUs reflected in this column is the target payout
based on the probable outcome of the performance condition, determined as of the grant date. The maximum potential values of the PSUs is 200% of target. For
2014, Mr. Novak’s PSU maximum value at grant date fair value would be $3,850,074; Mr. Grismer’s PSU maximum value would be $700,038; Mr. Su’s PSU
maximum value would be $900,090; Mr. Creed’s PSU maximum value would be $650,096; and Mr. Bergren’s PSU maximum value would be $550,070. In 2012,
Mr. Grismer did not receive a PSU award since he became a NEO after PSU awards were granted for that year. Mr. Grismer was instead permitted to defer his
annual incentive award into RSUs under the Company’s EID Program. Under the EID Program (which is described in more detail beginning on page 55), an
executive may defer his or her annual incentive award and invest that deferral into stock units, RSUs, or other investment alternatives offered under the EID
Program. An executive who elects to defer his or her annual incentive award into RSUs receives additional RSUs equal to 33% of the RSUs acquired with the
deferral of the annual incentive award (‘‘matching contribution’’). As a result, for 2012, the amount in that column represents the deferral of 100% of Mr. Grismer’s
annual incentive award ($760,760), plus his matching contribution ($253,587).
(3) The amounts shown in this column represent the grant date fair values of the stock options and stock appreciation rights (SARs) awarded in 2014, 2013 and
2012, respectively. For a discussion of the assumptions and methodologies used to value the awards reported in column (e) and column (f), please see the
discussion of stock awards and option awards contained in Part II, Item 8, ‘‘Financial Statements and Supplementary Data’’ of the 2014 Annual Report in Notes
to Consolidated Financial Statements at Note 14, ‘‘Share-based and Deferred Compensation Plans.’’ For Mr. Creed and Mr. Bergren, this column also includes
each of their 2014 Chairman’s Awards with a grant date fair value of $1,199,984. See the Grants of Plan-Based Awards table for details.
(4) Except as provided below and in footnote (2) above, amounts in this column reflect the annual incentive awards earned for the 2014, 2013 and 2012 fiscal year
performance periods, which were awarded by our Management Planning and Development Committee (‘‘Committee’’) in January 2015, January 2014 and
January 2013, respectively, under the Yum Leaders’ Bonus Program, which is described further in our Compensation Discussion and Analysis (‘‘CD&A’’)
beginning at page 28 under the heading ‘‘Annual Performance-Based Cash Bonuses’’. Pursuant to SEC rules, annual incentives deferred into RSUs under the
EID Program and subject to a risk of forfeiture are reported in column (e). If the deferral or a portion of the deferral is not subject to a risk of forfeiture, it is reported
in column (g). In 2012, Mr. Grismer elected to defer 100% of his annual incentive ($760,760) into RSUs resulting in nothing to report for him in this column for that
year.
(5) The amounts listed in this column for Mr. Novak, Mr. Creed and Mr. Bergren, reflect the aggregate increase in actuarial present value of each of their accrued
benefits under the YUM! Brands Retirement Plan (‘‘Retirement Plan’’) during the 2014 fiscal year (using interest rate and mortality assumptions consistent with
those used in the Company’s financial statements). Effective January 1, 2012, the Committee discontinued Mr. Novak’s accruing nonqualified pension benefits
under the YUM! Brands, Inc. Pension Equalization Plan (‘‘PEP’’) and, effective January 1, 2013, replaced his PEP benefit with a pension account determined
under the Leadership Retirement Plan (‘‘LRP’’). The amount transferred to his LRP-based pension account effective January 1, 2013 was $27,600,000
46 YUM! BRANDS, INC. 2015 Proxy Statement
Change in
Pension
Value and
Nonqualified
Option/ Non-Equity Deferred
Stock SAR Incentive Plan Compensation All Other
Name and Salary Bonus Awards Awards Compensation Earnings Compensation Total
Principal Position Year ($)(1) ($) ($)(2) ($)(3) ($)(4) ($)(5) ($)(6) ($)
(a) (b) (c) (d) (e) (f) (g) (h) (i)
EXECUTIVE COMPENSATION
Proxy Statement