Pizza Hut 2014 Annual Report Download - page 58
Download and view the complete annual report
Please find page 58 of the 2014 Pizza Hut annual report below. You can navigate through the pages in the report by either clicking on the pages listed below, or by using the keyword search tool below to find specific information within the annual report.-
 1
1 -
2
-
3
-
4
-
5
-
6
-
7
-
8
-
9
-
10
-
11
-
12
-
13
-
14
-
15
-
16
-
17
-
18
-
19
-
20
-
21
-
22
-
23
-
24
-
25
-
26
-
27
-
28
-
29
-
30
-
31
-
32
-
33
-
34
-
35
-
36
-
37
-
38
-
39
-
40
-
41
-
42
-
43
-
44
-
45
-
46
-
47
-
 48
48 -
 49
49 -
 50
50 -
 51
51 -
 52
52 -
 53
53 -
 54
54 -
 55
55 -
 56
56 -
 57
57 -
 58
58 -
 59
59 -
 60
60 -
 61
61 -
 62
62 -
 63
63 -
 64
64 -
 65
65 -
 66
66 -
 67
67 -
 68
68 -
69
-
70
-
71
-
72
-
73
-
74
-
75
-
76
-
77
-
78
-
79
-
80
-
81
-
82
-
83
-
84
-
85
-
86
-
87
-
88
-
89
-
90
-
91
-
92
-
93
-
94
-
95
-
96
-
97
-
98
-
99
-
100
-
101
-
102
-
103
-
104
-
105
-
106
-
107
-
108
-
109
-
110
-
111
-
112
-
113
-
114
-
115
-
116
-
117
-
118
-
119
-
120
-
121
-
122
-
123
-
124
-
125
-
126
-
127
-
128
-
129
-
130
-
131
-
132
-
133
-
134
-
135
-
136
-
137
-
138
-
139
-
140
-
141
-
142
-
143
-
144
-
145
-
146
-
147
-
148
-
149
-
150
-
151
-
152
-
153
-
154
-
155
-
156
-
157
-
158
-
159
-
160
-
161
-
162
-
163
-
164
-
165
-
166
-
167
-
168
-
169
-
170
-
171
-
172
-
173
-
174
-
175
-
176
 |
 |

15MAR201511093851
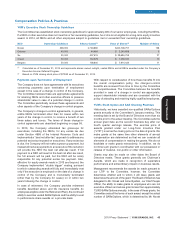
Executive Peer Group
The Committee established the current Executive Peer Group for all NEOs at the end of 2013 for pay determinations in 2014. The
2014 Executive Peer Group includes:
AutoZone Inc. H.J. Heinz Company McDonald’s Corporation
Avon Products Inc. J.C. Penney Company Inc. Nike Inc.
Campbell Soup Company Kellogg Company OfficeMax Inc.
Colgate Palmolive Company Kimberly-Clark Corporation Staples Inc.
Darden Restaurants Inc. Kohl’s Corporation Starbucks Corporation
Gap Inc. Macy’s Inc. Unilever USA
General Mills Inc. Marriott International
At the time the benchmarking analysis was prepared, the Historically and during 2014, the Company has generally
Executive Peer Group’s median revenues were $14.9 billion targeted pay for the CEO at the 75th percentile of the market
and enterprise value was $18.8 billion, while YUM’s were due to Mr. Novak’s sustained results. Specifically, 75th
estimated at $21.6 billion (calculated as described below) percentile total cash and total direct compensation. The
and $33 billion respectively. Company has a philosophy for all other NEOs to target the
50th percentile for base salary, 75th percentile for target
For companies with significant franchise operations, bonus and 50th percentile for long-term incentives. When
measuring size can be complex. There are added benchmarking for determining target bonus percentage, we
complexities and responsibilities for managing the use the average of our NEOs’ last three year’s actual bonus
relationships, arrangements, and overall scope of the paid rather than target bonus. When benchmarking and
franchising enterprise, in particular, managing product making decisions about the CEO’s SARs/Options, we use a
introductions, marketing, driving new unit development, and grant date fair value based on the full 10-year term rather
customer satisfaction and overall operations improvements than the expected term of all SARs/Options granted by the
across the entire franchise system. Accordingly, in calibrating Company. This methodology is a more appropriate method
size-adjusted market values, which values are as of the last to determine the award amount as it better reflects the actual
completed fiscal year at the time of study, our philosophy is to historical holding pattern for SARs/Options granted to our
add 25% of franchisee and licensee sales to the Company’s CEO. Our CEO receives fewer shares under this practice
revenues to establish an appropriate revenue benchmark. than if we used the expected term of all SARs/Options
The reason for this approach is based on our belief that the granted by the Company.
correct calibration of complexity and responsibility lies
between corporate-reported revenues and system-wide Our CEO’s and other NEOs’ (except for Mr. Grismer) target
revenues. total direct compensation was at or above the 75th percentile
of our Executive Peer Group for 2014 due to sustained long-
Competitive Positioning term results. Mr. Grismer’s compensation is set consistent
with our philosophy. It is important to emphasize that this
Meridian provided the Executive Peer Group compensation is the competitive positioning of our compensation
data to the Committee and it was used as a frame of opportunities. Realized pay, however, is driven substantially
reference for establishing compensation targets for base by Company performance, as discussed on page 30.
salary, annual bonus and long-term incentives for all of the
NEOs at the beginning of 2014. However, this data is not the As discussed on page 31, for 2015, the Company changed
only factor considered for our NEOs’ compensation, and it the compensation targets for the new CEO to be consistent
does not supplant the analyses of the individual performance with the philosophy for its other NEOs and set his 2015 total
of all of the NEOs. Because the comparative compensation target direct compensation below the median of our
information is one of several factors used in the setting of Executive Peer Group.
executive compensation, the Committee applies discretion in
determining the nature and extent of its use.
36 YUM! BRANDS, INC. 2015 Proxy Statement
EXECUTIVE COMPENSATION
Proxy Statement