Pizza Hut 2014 Annual Report Download - page 108
Download and view the complete annual report
Please find page 108 of the 2014 Pizza Hut annual report below. You can navigate through the pages in the report by either clicking on the pages listed below, or by using the keyword search tool below to find specific information within the annual report.-
 1
1 -
2
-
3
-
4
-
5
-
6
-
7
-
8
-
9
-
10
-
11
-
12
-
13
-
14
-
15
-
16
-
17
-
18
-
19
-
20
-
21
-
22
-
23
-
24
-
25
-
26
-
27
-
28
-
29
-
30
-
31
-
32
-
33
-
34
-
35
-
36
-
37
-
38
-
39
-
40
-
41
-
42
-
43
-
44
-
45
-
46
-
47
-
48
-
49
-
50
-
51
-
52
-
53
-
54
-
55
-
56
-
57
-
58
-
59
-
60
-
61
-
62
-
63
-
64
-
65
-
66
-
67
-
68
-
69
-
70
-
71
-
72
-
73
-
74
-
75
-
76
-
77
-
78
-
79
-
80
-
81
-
82
-
83
-
84
-
85
-
86
-
87
-
88
-
89
-
90
-
91
-
92
-
93
-
94
-
95
-
96
-
97
-
 98
98 -
 99
99 -
 100
100 -
 101
101 -
 102
102 -
 103
103 -
 104
104 -
 105
105 -
 106
106 -
 107
107 -
 108
108 -
 109
109 -
 110
110 -
 111
111 -
 112
112 -
 113
113 -
 114
114 -
 115
115 -
 116
116 -
 117
117 -
 118
118 -
119
-
120
-
121
-
122
-
123
-
124
-
125
-
126
-
127
-
128
-
129
-
130
-
131
-
132
-
133
-
134
-
135
-
136
-
137
-
138
-
139
-
140
-
141
-
142
-
143
-
144
-
145
-
146
-
147
-
148
-
149
-
150
-
151
-
152
-
153
-
154
-
155
-
156
-
157
-
158
-
159
-
160
-
161
-
162
-
163
-
164
-
165
-
166
-
167
-
168
-
169
-
170
-
171
-
172
-
173
-
174
-
175
-
176
 |
 |

13MAR201517272138
PART II
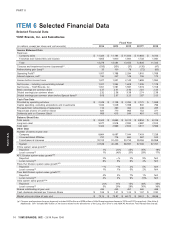
Selected Financial Data
Selected Financial Data
YUM! Brands, Inc. and Subsidiaries
Fiscal Year
(in millions, except per share and unit amounts) 2014 2013 2012 2011(h) 2010
Income Statement Data
Revenues
Company sales $ 11,324 $ 11,184 $ 11,833 $ 10,893 $ 9,783
Franchise and license fees and income 1,955 1,900 1,800 1,733 1,560
Total 13,279 13,084 13,633 12,626 11,343
Closures and impairment income (expenses)(a) (535) (331) (37) (135) (47)
Refranchising gain (loss)(b) 33 100 78 (72) (63)
Operating Profit(c) 1,557 1,798 2,294 1,815 1,769
Interest expense, net(c) 130 247 149 156 175
Income before income taxes 1,427 1,551 2,145 1,659 1,594
Net Income – including noncontrolling interest 1,021 1,064 1,608 1,335 1,178
Net Income – YUM! Brands, Inc. 1,051 1,091 1,597 1,319 1,158
Basic earnings per common share 2.37 2.41 3.46 2.81 2.44
Diluted earnings per common share 2.32 2.36 3.38 2.74 2.38
Diluted earnings per common share before Special Items(c) 3.09 2.97 3.25 2.87 2.53
Cash Flow Data
Provided by operating activities $ 2,049 $ 2,139 $ 2,294 $ 2,170 $ 1,968
Capital spending, excluding acquisitions and investments 1,033 1,049 1,099 940 796
Proceeds from refranchising of restaurants 114 260 364 246 265
Repurchase shares of Common Stock 820 770 965 752 371
Dividends paid on Common Stock 669 615 544 481 412
Balance Sheet Data
Total assets $ 8,345 $ 8,695 $ 9,013 $ 8,834 $ 8,316
Long-term debt 3,077 2,918 2,932 2,997 2,915
Total debt 3,344 2,989 2,942 3,317 3,588
Other Data
Number of stores at year end
Company 8,664 8,097 7,544 7,403 7,238
Unconsolidated Affiliates 757 716 660 587 525
Franchisees & licensees 32,125 31,420 30,733 29,056 29,998
System 41,546 40,233 38,937 37,046 37,761
China system sales growth(d)
Reported 1% (1)% 23% 35% 18%
Local currency(e) 1% (4)% 20% 29% 17%
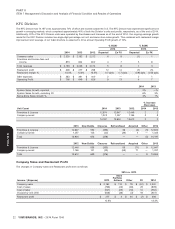
KFC Division system sales growth(d)(f)
Reported 2% —% 2% 9% N/A
Local currency(e) 6% 3% 6% 4% N/A
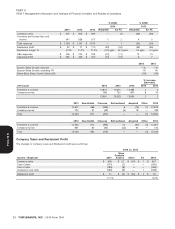
Pizza Hut Division system sales growth(d)(f)
Reported —% —% 2% 5% N/A
Local currency(e) 1% 1% 5% 2% N/A
Taco Bell Division system sales growth(d)(f)
Reported 4% 4% 7% 1% N/A
Local currency(e) 4% 4% 9% (1)% N/A
India system sales growth(d)(g)
Reported (1)% 11% 13% 36% 43%
Local currency(e) 3% 20% 29% 35% 36%
Shares outstanding at year end 434 443 451 460 469
Cash dividends declared per Common Share $ 1.56 $ 1.41 $ 1.24 $ 1.07 $ 0.92
Market price per share at year end $ 73.14 $ 73.87 $ 64.72 $ 59.01 $ 49.66
(a) Closures and impairment income (expense) includes $463 million and $295 million of Little Sheep impairment losses in 2014 and 2013 respectively, (See Note 4).
Additionally, 2011 included $80 million of net losses related to the divestitures of the Long John Silver’s and A&W All American Food Restaurants brands.
14 YUM! BRANDS, INC. - 2014 Form 10-K
ITEM 6
Form 10-K