Pizza Hut 2014 Annual Report Download - page 143
Download and view the complete annual report
Please find page 143 of the 2014 Pizza Hut annual report below. You can navigate through the pages in the report by either clicking on the pages listed below, or by using the keyword search tool below to find specific information within the annual report.-
 1
1 -
2
-
3
-
4
-
5
-
6
-
7
-
8
-
9
-
10
-
11
-
12
-
13
-
14
-
15
-
16
-
17
-
18
-
19
-
20
-
21
-
22
-
23
-
24
-
25
-
26
-
27
-
28
-
29
-
30
-
31
-
32
-
33
-
34
-
35
-
36
-
37
-
38
-
39
-
40
-
41
-
42
-
43
-
44
-
45
-
46
-
47
-
48
-
49
-
50
-
51
-
52
-
53
-
54
-
55
-
56
-
57
-
58
-
59
-
60
-
61
-
62
-
63
-
64
-
65
-
66
-
67
-
68
-
69
-
70
-
71
-
72
-
73
-
74
-
75
-
76
-
77
-
78
-
79
-
80
-
81
-
82
-
83
-
84
-
85
-
86
-
87
-
88
-
89
-
90
-
91
-
92
-
93
-
94
-
95
-
96
-
97
-
98
-
99
-
100
-
101
-
102
-
103
-
104
-
105
-
106
-
107
-
108
-
109
-
110
-
111
-
112
-
113
-
114
-
115
-
116
-
117
-
118
-
119
-
120
-
121
-
122
-
123
-
124
-
125
-
126
-
127
-
128
-
129
-
130
-
131
-
132
-
 133
133 -
 134
134 -
 135
135 -
 136
136 -
 137
137 -
 138
138 -
 139
139 -
 140
140 -
 141
141 -
 142
142 -
 143
143 -
 144
144 -
 145
145 -
 146
146 -
 147
147 -
 148
148 -
 149
149 -
 150
150 -
 151
151 -
 152
152 -
 153
153 -
154
-
155
-
156
-
157
-
158
-
159
-
160
-
161
-
162
-
163
-
164
-
165
-
166
-
167
-
168
-
169
-
170
-
171
-
172
-
173
-
174
-
175
-
176
 |
 |

PART II
ITEM 8 Financial Statements and Supplementary Data
recognized in our Consolidated Statement of Income is recorded as a the greater of a plan’s projected benefit obligation or market-related
component of Accumulated other comprehensive income (loss). value of assets, over the remaining service period of active
participants in the plan or, for plans with no active participants, over
The net periodic benefit costs associated with the Company’s defined the expected average life expectancy of the inactive participants in the
benefit pension and post-retirement medical plans are determined plan. We record a curtailment when an event occurs that significantly
using assumptions regarding the projected benefit obligation and, for reduces the expected years of future service or eliminates the accrual
funded plans, the market-related value of plan assets as of the of defined benefits for the future services of a significant number of
beginning of each year. We have elected to use a market-related employees. We record a curtailment gain when the employees who
value of plan assets to calculate the expected return on assets in net are entitled to the benefits terminate their employment; we record a
periodic benefit costs. We recognize differences in the fair value curtailment loss when it becomes probable a loss will occur.
versus the market-related value of plan assets evenly over five years.
For each individual plan we amortize into pension expense the net We recognize settlement gains or losses only when we have
amounts in Accumulated other comprehensive income (loss), as determined that the cost of all settlements in a year will exceed the
adjusted for the difference between the fair value and market-related sum of the service and interest costs within an individual plan.
value of plan assets, to the extent that such amounts exceed 10% of
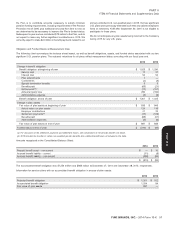
Earnings Per Common Share (‘‘EPS’’)
2014 2013 2012
Net Income – YUM! Brands, Inc. $ 1,051 $ 1,091 $ 1,597
Weighted-average common shares outstanding (for basic calculation) 444 452 461
Effect of dilutive share-based employee compensation 9 9 12
Weighted-average common and dilutive potential common shares outstanding (for diluted
calculation) 453 461 473
Basic EPS $ 2.37 $ 2.41 $ 3.46
Diluted EPS $ 2.32 $ 2.36 $ 3.38
Unexercised employee stock options and stock appreciation rights (in millions) excluded from
the diluted EPS computation(a) 5.5 4.9 3.1
(a) These unexercised employee stock options and stock appreciation rights were not included in the computation of diluted EPS because to do so would have been
antidilutive for the periods presented.
Items Affecting Comparability of Net Income and Cash Flows
purchase approval and ownership transition phase, and our efforts to
Little Sheep Acquisition and Subsequent regain sales momentum were significantly compromised in May 2013
Impairment due to negative publicity regarding quality issues with unrelated hot
pot concepts in China, even though there was not an issue with the
On February 1, 2012 we acquired an additional 66% interest in Little quality of Little Sheep products.
Sheep Group Limited (‘‘Little Sheep’’) for $540 million, net of cash
acquired of $44 million, increasing our ownership to 93%. The The sustained declines in sales and profits resulted in a determination
acquisition was driven by our strategy to build leading brands across that the Little Sheep trademark, goodwill and certain restaurant level
China in every significant category. Prior to our acquisition of this PP&E were impaired during the quarter ended September 7, 2013. As
additional interest, our 27% interest in Little Sheep was accounted for a result, we recorded impairment charges to the trademark, goodwill
under the equity method of accounting. As a result of the acquisition and PP&E of $69 million, $222 million and $4 million, respectively,
we obtained voting control of Little Sheep, and thus we began during the quarter ended September 7, 2013.
consolidating Little Sheep upon acquisition. As required by GAAP, we
The inputs used in determining the 2013 fair values of the Little Sheep
re-measured our previously held 27% ownership in Little Sheep,
trademark and reporting unit assumed that the business would
which had a recorded value of $107 million at the date of acquisition,
recover to pre-acquisition average-unit sales volumes and profit levels
at fair value based on Little Sheep’s traded share price immediately
over the then next three years, supporting significant future new unit
prior to our offer to purchase the business and recognized a non-cash
development by the Company. Long-term average growth
gain of $74 million, with no related tax benefit within Other (income)
assumptions subsequent to this assumed recovery included
expense.
same-store-sales growth of 4% and average annual net unit growth of
The primary assets recorded as a result of the acquisition were the approximately 75 units, primarily operated by the Company.
Little Sheep trademark and goodwill of approximately $400 million and
The Little Sheep business continued to underperform during 2014
$375 million, respectively.
with actual average-unit sales volumes and profit levels significantly
The purchase price paid for the additional 66% interest and the below those assumed in our 2013 estimation of the Little Sheep
resulting purchase price allocation in 2012 assumed same-store sales trademark and reporting unit fair values. As a result, a significant
growth and new unit development for the brand. However, Little number of Company-operated restaurants were closed or
Sheep’s sales were negatively impacted by a longer than expected
YUM! BRANDS, INC. - 2014 Form 10-K 49
NOTE 3
NOTE 4
13MAR201516053226
Form 10-K