Pizza Hut 2014 Annual Report Download - page 115
Download and view the complete annual report
Please find page 115 of the 2014 Pizza Hut annual report below. You can navigate through the pages in the report by either clicking on the pages listed below, or by using the keyword search tool below to find specific information within the annual report.-
 1
1 -
2
-
3
-
4
-
5
-
6
-
7
-
8
-
9
-
10
-
11
-
12
-
13
-
14
-
15
-
16
-
17
-
18
-
19
-
20
-
21
-
22
-
23
-
24
-
25
-
26
-
27
-
28
-
29
-
30
-
31
-
32
-
33
-
34
-
35
-
36
-
37
-
38
-
39
-
40
-
41
-
42
-
43
-
44
-
45
-
46
-
47
-
48
-
49
-
50
-
51
-
52
-
53
-
54
-
55
-
56
-
57
-
58
-
59
-
60
-
61
-
62
-
63
-
64
-
65
-
66
-
67
-
68
-
69
-
70
-
71
-
72
-
73
-
74
-
75
-
76
-
77
-
78
-
79
-
80
-
81
-
82
-
83
-
84
-
85
-
86
-
87
-
88
-
89
-
90
-
91
-
92
-
93
-
94
-
95
-
96
-
97
-
98
-
99
-
100
-
101
-
102
-
103
-
104
-
 105
105 -
 106
106 -
 107
107 -
 108
108 -
 109
109 -
 110
110 -
 111
111 -
 112
112 -
 113
113 -
 114
114 -
 115
115 -
 116
116 -
 117
117 -
 118
118 -
 119
119 -
 120
120 -
 121
121 -
 122
122 -
 123
123 -
 124
124 -
 125
125 -
126
-
127
-
128
-
129
-
130
-
131
-
132
-
133
-
134
-
135
-
136
-
137
-
138
-
139
-
140
-
141
-
142
-
143
-
144
-
145
-
146
-
147
-
148
-
149
-
150
-
151
-
152
-
153
-
154
-
155
-
156
-
157
-
158
-
159
-
160
-
161
-
162
-
163
-
164
-
165
-
166
-
167
-
168
-
169
-
170
-
171
-
172
-
173
-
174
-
175
-
176
 |
 |

PART II
ITEM 7 Management’s Discussion and Analysis of Financial Condition and Results of Operations
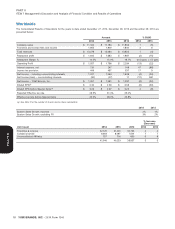
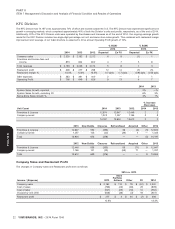
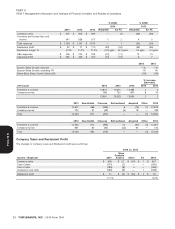
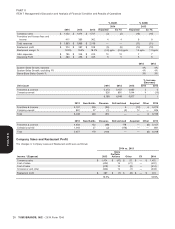
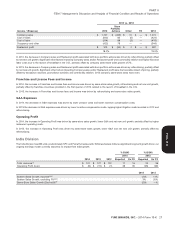
Company Sales and Restaurant Profit
The changes in Company sales and Restaurant profit were as follows:
2014 vs. 2013
Store
Portfolio
Income / (Expense) 2013 Actions Other FX 2014
Company sales $ 6,800 $ 358 $ (322) $ (15) $ 6,821
Cost of sales (2,258) (104) 151 4 (2,207)
Cost of labor (1,360) (75) 26 2 (1,407)
Occupancy and other (2,132) (124) 52 6 (2,198)
Restaurant profit $ 1,050 $ 55 $ (93) $ (3) $ 1,009
15.4% 14.8%
2013 vs. 2012
Store
Portfolio
Income / (Expense) 2012 Actions Other FX 2013
Company sales $ 6,797 $ 611 $ (785) $ 177 $ 6,800
Cost of sales (2,312) (190) 303 (59) (2,258)
Cost of labor (1,259) (129) 62 (34) (1,360)
Occupancy and other (1,993) (211) 127 (55) (2,132)
Restaurant profit $ 1,233 $ 81 $ (293) $ 29 $ 1,050
18.1% 15.4%
In 2014, the increase in Company sales and Restaurant profit associated with store portfolio actions was driven by net new unit growth. Significant
other factors impacting Company sales and/or Restaurant profit were wage rate inflation of 9% and same-store sales declines of 5% which led to
inefficiencies in Cost of sales, partially offset by labor efficiencies and lower advertising expense. See the Summary at the beginning of this
section for discussion of China sales.
In 2013, the increase in Company sales and Restaurant profit associated with store portfolio actions was driven by net new unit growth and the
2012 acquisition of Little Sheep. Significant other factors impacting Company sales and/or Restaurant profit were Company same-store sales
declines of 12% and the impact of wage rate inflation of 7%, partially offset by restaurant operating efficiencies. See the Summary at the beginning
of this section for discussion of China sales.
Franchise and License Fees and Income
In 2014, the increase in Franchise and license fees and income, excluding the impact of foreign currency translation, was driven by the impact of
refranchising, partially offset by franchise same-store sales declines.
In 2013, the increase in Franchise and license fees and income, excluding the impact of foreign currency translation, was driven by refranchising
and franchise net new unit development, partially offset by franchise same-store sales declines.
G&A Expenses
In 2014, the increase in G&A expenses, excluding the impact of foreign currency translation, was driven by compensation costs due to higher
headcount and wage inflation.
In 2013, the increase in G&A expenses, excluding the impact of foreign currency translation, was driven by increased compensation costs due to
higher headcount and wage inflation and additional G&A as a result of consolidating Little Sheep beginning in the second quarter of 2012, partially
offset by lower incentive compensation costs.
Operating Profit
In 2014, the decrease in Operating Profit, excluding the impact of foreign currency translation, was driven by same-store sales declines, higher
restaurant operating costs and higher G&A expenses, partially offset by net new unit growth and increased Other income due to an insurance
recovery related to the 2012 poultry supply incident. See the Summary at the beginning of this section for discussion of China sales.
In 2013, the decrease in Operating Profit, excluding the impact of foreign currency translation, was driven by same-store sales declines at KFC,
partially offset by the impact of net new unit growth and restaurant operating efficiencies. See the Summary at the beginning of this section for
discussion of China sales.
YUM! BRANDS, INC. - 2014 Form 10-K 21
13MAR201516053226
Form 10-K