Pizza Hut 2014 Annual Report Download - page 152
Download and view the complete annual report
Please find page 152 of the 2014 Pizza Hut annual report below. You can navigate through the pages in the report by either clicking on the pages listed below, or by using the keyword search tool below to find specific information within the annual report.-
 1
1 -
2
-
3
-
4
-
5
-
6
-
7
-
8
-
9
-
10
-
11
-
12
-
13
-
14
-
15
-
16
-
17
-
18
-
19
-
20
-
21
-
22
-
23
-
24
-
25
-
26
-
27
-
28
-
29
-
30
-
31
-
32
-
33
-
34
-
35
-
36
-
37
-
38
-
39
-
40
-
41
-
42
-
43
-
44
-
45
-
46
-
47
-
48
-
49
-
50
-
51
-
52
-
53
-
54
-
55
-
56
-
57
-
58
-
59
-
60
-
61
-
62
-
63
-
64
-
65
-
66
-
67
-
68
-
69
-
70
-
71
-
72
-
73
-
74
-
75
-
76
-
77
-
78
-
79
-
80
-
81
-
82
-
83
-
84
-
85
-
86
-
87
-
88
-
89
-
90
-
91
-
92
-
93
-
94
-
95
-
96
-
97
-
98
-
99
-
100
-
101
-
102
-
103
-
104
-
105
-
106
-
107
-
108
-
109
-
110
-
111
-
112
-
113
-
114
-
115
-
116
-
117
-
118
-
119
-
120
-
121
-
122
-
123
-
124
-
125
-
126
-
127
-
128
-
129
-
130
-
131
-
132
-
133
-
134
-
135
-
136
-
137
-
138
-
139
-
140
-
141
-
 142
142 -
 143
143 -
 144
144 -
 145
145 -
 146
146 -
 147
147 -
 148
148 -
 149
149 -
 150
150 -
 151
151 -
 152
152 -
 153
153 -
 154
154 -
 155
155 -
 156
156 -
 157
157 -
 158
158 -
 159
159 -
 160
160 -
 161
161 -
 162
162 -
163
-
164
-
165
-
166
-
167
-
168
-
169
-
170
-
171
-
172
-
173
-
174
-
175
-
176
 |
 |

13MAR201517272138
PART II
ITEM 8 Financial Statements and Supplementary Data
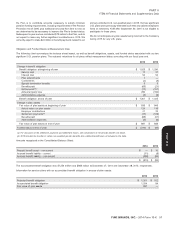
Information for pension plans with a projected benefit obligation in excess of plan assets:
2014 2013
Projected benefit obligation $ 1,301 $ 102
Accumulated benefit obligation 1,254 94
Fair value of plan assets 991 —
Components of net periodic benefit cost:
Net periodic benefit cost 2014 2013 2012
Service cost $17$21$26
Interest cost 54 54 66
Amortization of prior service cost(a) 121
Expected return on plan assets (56) (59) (71)
Amortization of net loss 17 48 63
Net periodic benefit cost $33$66$85
Additional (gain) loss recognized due to:
Settlements(b) $6$30$89
Special termination benefits $3$5$3
(a) Prior service costs are amortized on a straight-line basis over the average remaining service period of employees expected to receive benefits.
(b) Settlement losses result when benefit payments exceed the sum of the service cost and interest cost within a plan during the year. During the fourth quarter of
2012 and continuing through 2013, the Company allowed certain former employees with deferred vested balances an opportunity to voluntarily elect an early
payout of their pension benefits. The majority of these payouts were funded from existing pension plan assets. See Note 4.
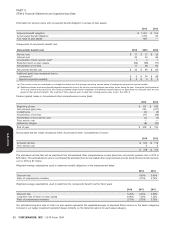
Pension (gains) losses in Accumulated other comprehensive income (loss):
2014 2013
Beginning of year $ 124 $ 428
Net actuarial (gain) loss 220 (221)
Curtailments (2) (3)
Amortization of net loss (17) (48)
Amortization of prior service cost (1) (2)
Prior service cost 1—
Settlement charges (6) (30)
End of year $ 319 $ 124
Accumulated pre-tax losses recognized within Accumulated Other Comprehensive Income:
2014 2013
Actuarial net loss $ 314 $ 119
Prior service cost 55
$ 319 $ 124
The estimated net loss that will be amortized from Accumulated other comprehensive income (loss) into net periodic pension cost in 2015 is
$45 million. The estimated prior service cost that will be amortized from Accumulated other comprehensive income (loss) into net periodic pension
cost in 2015 is $1 million.
Weighted-average assumptions used to determine benefit obligations at the measurement dates:
2014 2013
Discount rate 4.30% 5.40%
Rate of compensation increase 3.75% 3.75%
Weighted-average assumptions used to determine the net periodic benefit cost for fiscal years:
2014 2013 2012
Discount rate 5.40% 4.40% 4.90%
Long-term rate of return on plan assets 6.90% 7.25% 7.25%
Rate of compensation increase 3.75% 3.75% 3.75%
Our estimated long-term rate of return on plan assets represents the weighted-average of expected future returns on the asset categories
included in our target investment allocation based primarily on the historical returns for each asset category.
58 YUM! BRANDS, INC. - 2014 Form 10-K
Form 10-K