Pizza Hut 2014 Annual Report Download - page 123
Download and view the complete annual report
Please find page 123 of the 2014 Pizza Hut annual report below. You can navigate through the pages in the report by either clicking on the pages listed below, or by using the keyword search tool below to find specific information within the annual report.-
 1
1 -
2
-
3
-
4
-
5
-
6
-
7
-
8
-
9
-
10
-
11
-
12
-
13
-
14
-
15
-
16
-
17
-
18
-
19
-
20
-
21
-
22
-
23
-
24
-
25
-
26
-
27
-
28
-
29
-
30
-
31
-
32
-
33
-
34
-
35
-
36
-
37
-
38
-
39
-
40
-
41
-
42
-
43
-
44
-
45
-
46
-
47
-
48
-
49
-
50
-
51
-
52
-
53
-
54
-
55
-
56
-
57
-
58
-
59
-
60
-
61
-
62
-
63
-
64
-
65
-
66
-
67
-
68
-
69
-
70
-
71
-
72
-
73
-
74
-
75
-
76
-
77
-
78
-
79
-
80
-
81
-
82
-
83
-
84
-
85
-
86
-
87
-
88
-
89
-
90
-
91
-
92
-
93
-
94
-
95
-
96
-
97
-
98
-
99
-
100
-
101
-
102
-
103
-
104
-
105
-
106
-
107
-
108
-
109
-
110
-
111
-
112
-
 113
113 -
 114
114 -
 115
115 -
 116
116 -
 117
117 -
 118
118 -
 119
119 -
 120
120 -
 121
121 -
 122
122 -
 123
123 -
 124
124 -
 125
125 -
 126
126 -
 127
127 -
 128
128 -
 129
129 -
 130
130 -
 131
131 -
 132
132 -
 133
133 -
134
-
135
-
136
-
137
-
138
-
139
-
140
-
141
-
142
-
143
-
144
-
145
-
146
-
147
-
148
-
149
-
150
-
151
-
152
-
153
-
154
-
155
-
156
-
157
-
158
-
159
-
160
-
161
-
162
-
163
-
164
-
165
-
166
-
167
-
168
-
169
-
170
-
171
-
172
-
173
-
174
-
175
-
176
 |
 |

PART II
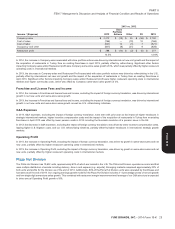
ITEM 7 Management’s Discussion and Analysis of Financial Condition and Results of Operations
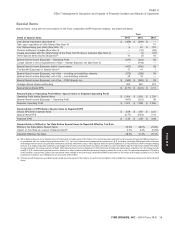
Interest Expense, Net
The decrease in interest expense, net for 2014 was driven by lapping $118 million of premiums paid and other costs related to the extinguishment
of debt in 2013. The increase in 2013 versus 2012 due to this extinguishment was partially offset by lower average borrowings outstanding and
lower interest rates versus 2012. See Note 4.
Income Tax Provision
In 2014, 2013 and 2012, the reported effective income tax rates were 28.5%, 31.4% and 25.0%, respectively. See Note 16 for further discussion of
our income tax provision.
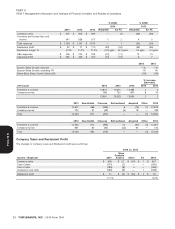
Consolidated Cash Flows
Net cash provided by operating activities was $2,049 million in In 2013, net cash used in investing activities was $886 million
2014 versus $2,139 million in 2013. The decrease was primarily compared to $1,005 million in 2012. The decrease was primarily
driven by higher income taxes paid. driven by lapping the acquisition of Little Sheep and release of related
restricted cash. See Note 4.
In 2013, net cash provided by operating activities was $2,139 million
compared to $2,294 million in 2012. The decrease was primarily due Net cash used in financing activities was $1,114 million in 2014
to lower Operating Profit before Special Items and higher income compared to $1,451 million in 2013. The decrease was primarily
taxes paid, partially offset by approximately $100 million in lower driven by higher borrowings on our revolving credit facility.
pension contributions.
In 2013, net cash used in financing activities was $1,451 million
Net cash used in investing activities was $936 million in 2014 compared to $1,716 million in 2012. The decrease was primarily
compared to $886 million in 2013. The increase was primarily driven driven by lower net debt payments and lower share repurchases in
by lower refranchising proceeds, partially offset by lapping the 2013, partially offset by higher dividends paid on common stock and
acquisition of restaurants in Turkey from an existing franchisee in April lower tax benefits from share-based compensation.
2013.
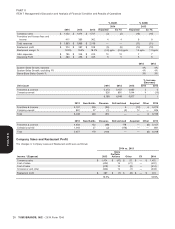
Consolidated Financial Condition
The change in our Goodwill and Intangible assets, net is primarily the Long-term debt is also impacted by outstanding borrowings of
result of the impairment of Little Sheep’s goodwill and trademark. See $416 million under our revolving credit facility as of December 27,
Note 4. 2014. See Note 10.
The changes in our Short-term borrowings and Long-term debt are The decrease in Accumulated other comprehensive income (loss) is
primarily due to the classification of $250 million in Senior Unsecured primarily the result of currency translation adjustment losses and net
Notes as short-term due to their September 2015 maturity date. actuarial losses in our U.S. pension plans. See Note 15.
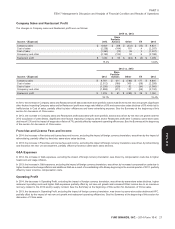
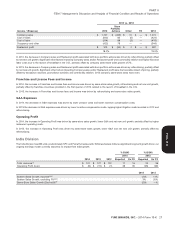
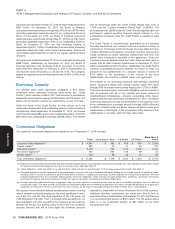
Liquidity and Capital Resources
Operating in the QSR industry allows us to generate substantial cash have historically been able to do so in a tax-efficient manner. If we
flows from the operations of our company-owned stores and from our experience an unforeseen decrease in our cash flows from our U.S.
extensive franchise operations which require a limited YUM businesses or are unable to refinance future U.S. debt maturities we
investment. Net cash provided by operating activities has exceeded may be required to repatriate future international earnings at tax rates
$1 billion in each of the last thirteen fiscal years, including over higher than we have historically experienced.
$2 billion in each fiscal year since 2011. We expect these levels of net We currently have investment-grade ratings from Standard & Poor’s
cash provided by operating activities to continue in the foreseeable Rating Services (BBB) and Moody’s Investors Service (Baa3). While
future. However, unforeseen downturns in our business could we do not anticipate a downgrade in our credit rating, a downgrade
adversely impact our cash flows from operations from the levels would increase the Company’s current borrowing costs and could
historically realized. impact the Company’s ability to access the credit markets cost
In the event our cash flows from operating activities are negatively effectively if necessary. Based on the amount and composition of our
impacted by business downturns, we believe we have the ability to debt at December 27, 2014, our interest expense would not materially
temporarily reduce our discretionary spending without significant increase on a full-year basis should we receive a one-level downgrade
impact to our long-term business prospects. Our discretionary in our ratings.
spending includes capital spending for new restaurants, acquisitions
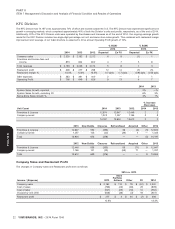
of restaurants from franchisees, repurchases of shares of our Discretionary Spending
Common Stock and dividends paid to our shareholders.
During 2014, we invested $1,033 million in capital spending, including
We generate a significant amount of cash from operating activities $525 million in China, $273 million in KFC, $62 million in Pizza Hut,
outside the U.S. that we have used historically to fund our $143 million in Taco Bell and $21 million in India. For 2015, we
international development. To the extent we have needed to repatriate estimate capital spending will be approximately $1.1 billion.
international cash to fund our U.S. discretionary cash spending,
including share repurchases, dividends and debt repayments, we
YUM! BRANDS, INC. - 2014 Form 10-K 29
13MAR201516053226
Form 10-K