Pizza Hut 2014 Annual Report Download - page 61
Download and view the complete annual report
Please find page 61 of the 2014 Pizza Hut annual report below. You can navigate through the pages in the report by either clicking on the pages listed below, or by using the keyword search tool below to find specific information within the annual report.-
 1
1 -
2
-
3
-
4
-
5
-
6
-
7
-
8
-
9
-
10
-
11
-
12
-
13
-
14
-
15
-
16
-
17
-
18
-
19
-
20
-
21
-
22
-
23
-
24
-
25
-
26
-
27
-
28
-
29
-
30
-
31
-
32
-
33
-
34
-
35
-
36
-
37
-
38
-
39
-
40
-
41
-
42
-
43
-
44
-
45
-
46
-
47
-
48
-
49
-
50
-
 51
51 -
 52
52 -
 53
53 -
 54
54 -
 55
55 -
 56
56 -
 57
57 -
 58
58 -
 59
59 -
 60
60 -
 61
61 -
 62
62 -
 63
63 -
 64
64 -
 65
65 -
 66
66 -
 67
67 -
 68
68 -
 69
69 -
 70
70 -
 71
71 -
72
-
73
-
74
-
75
-
76
-
77
-
78
-
79
-
80
-
81
-
82
-
83
-
84
-
85
-
86
-
87
-
88
-
89
-
90
-
91
-
92
-
93
-
94
-
95
-
96
-
97
-
98
-
99
-
100
-
101
-
102
-
103
-
104
-
105
-
106
-
107
-
108
-
109
-
110
-
111
-
112
-
113
-
114
-
115
-
116
-
117
-
118
-
119
-
120
-
121
-
122
-
123
-
124
-
125
-
126
-
127
-
128
-
129
-
130
-
131
-
132
-
133
-
134
-
135
-
136
-
137
-
138
-
139
-
140
-
141
-
142
-
143
-
144
-
145
-
146
-
147
-
148
-
149
-
150
-
151
-
152
-
153
-
154
-
155
-
156
-
157
-
158
-
159
-
160
-
161
-
162
-
163
-
164
-
165
-
166
-
167
-
168
-
169
-
170
-
171
-
172
-
173
-
174
-
175
-
176
 |
 |

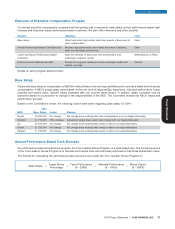
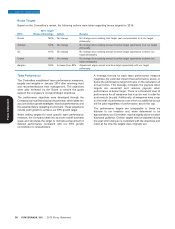
Detailed Breakdown of 2014 Team Performance
The team performance targets, actual results, weights and overall performance for each measure for our NEOs are outlined below.
Novak, Grismer Weighted Average Divisions’ Team 68 50% 34
Factors(1)
Earnings Per Share Growth 20% 4% 0 50% 0
(excluding special items)
FINAL YUM TEAM FACTOR 34
Su Operating Profit Growth(2) 34% (8)% 0 50% 0
System Sales Growth(2) 20% 1% 0 20% 0
System Gross New Builds 650 737 200 20% 40
System Customer Satisfaction Weighted Average(5) 101 10% 10
Total Weighted Team Performance — 50
China Division
FINAL CHINA TEAM FACTOR(3) 46
Creed Operating Profit Growth(2) 7% 5% 48 40% 19
System Same-Store Sales Growth 3% 3% 97 20% 19
System Net Builds(6) 100 180 200 20% 40
Customer Operations Review and 84% 84% 120 10% 12
Evaluation (CORE)
System Customer Satisfaction 66% 68% 148 10% 15
Total Weighted Team Performance — 105
Taco Bell
Final Taco Bell Team Factor(3) 87
Chairman’s Incentive Points(4) 10
FINAL TACO BELL TEAM FACTOR 97
Bergren Operating Profit Growth(2) 6% (13)% 0 50% 0
System Same-Store Sales Growth 3% (1)% 0 15% 0
System Net Builds(7) 302 282 73 20% 15
System Customer Satisfaction Weighted Average(8) 155 15% 23
Total Weighted Team Performance — 38
Pizza Hut Division
FINAL PIZZA HUT TEAM FACTOR(3) 37
(1) Weighted average based on each Division’s contribution to overall segment operating profit of YUM in 2013, not including 10 Chairman’s
Incentive Points given to Taco Bell.
(2) Excludes the impact of foreign exchange.
(3) Final team factor reflects 75% division and 25% YUM weighting.
(4) As recommended by the Chairman and approved by the Committee, Taco Bell received 10 additional discretionary points for sharing know-
how across divisions, mobile application rollout, breakfast rollout, restaurant culture leadership, and profit growth performance in the face of
strong commodity headwinds.
(5) Weighted average of each Brand’s Team Factor based on number of restaurants.
(6) Includes US units only. Excludes licensed units.
(7) Excludes US licensed units.
(8) Weighted average of each subsidiary business unit’s Team Factor based on number of restaurants.
2015 Proxy Statement YUM! BRANDS, INC. 39
TEAM PERFORMANCE
Earned Award Final Team
NEO Measures Target Actual as % of Target Weighting Performance
EXECUTIVE COMPENSATION
Proxy Statement