Pizza Hut 2014 Annual Report Download - page 145
Download and view the complete annual report
Please find page 145 of the 2014 Pizza Hut annual report below. You can navigate through the pages in the report by either clicking on the pages listed below, or by using the keyword search tool below to find specific information within the annual report.-
 1
1 -
2
-
3
-
4
-
5
-
6
-
7
-
8
-
9
-
10
-
11
-
12
-
13
-
14
-
15
-
16
-
17
-
18
-
19
-
20
-
21
-
22
-
23
-
24
-
25
-
26
-
27
-
28
-
29
-
30
-
31
-
32
-
33
-
34
-
35
-
36
-
37
-
38
-
39
-
40
-
41
-
42
-
43
-
44
-
45
-
46
-
47
-
48
-
49
-
50
-
51
-
52
-
53
-
54
-
55
-
56
-
57
-
58
-
59
-
60
-
61
-
62
-
63
-
64
-
65
-
66
-
67
-
68
-
69
-
70
-
71
-
72
-
73
-
74
-
75
-
76
-
77
-
78
-
79
-
80
-
81
-
82
-
83
-
84
-
85
-
86
-
87
-
88
-
89
-
90
-
91
-
92
-
93
-
94
-
95
-
96
-
97
-
98
-
99
-
100
-
101
-
102
-
103
-
104
-
105
-
106
-
107
-
108
-
109
-
110
-
111
-
112
-
113
-
114
-
115
-
116
-
117
-
118
-
119
-
120
-
121
-
122
-
123
-
124
-
125
-
126
-
127
-
128
-
129
-
130
-
131
-
132
-
133
-
134
-
 135
135 -
 136
136 -
 137
137 -
 138
138 -
 139
139 -
 140
140 -
 141
141 -
 142
142 -
 143
143 -
 144
144 -
 145
145 -
 146
146 -
 147
147 -
 148
148 -
 149
149 -
 150
150 -
 151
151 -
 152
152 -
 153
153 -
 154
154 -
 155
155 -
156
-
157
-
158
-
159
-
160
-
161
-
162
-
163
-
164
-
165
-
166
-
167
-
168
-
169
-
170
-
171
-
172
-
173
-
174
-
175
-
176
 |
 |

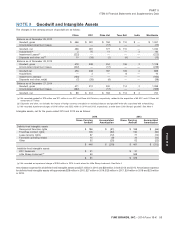
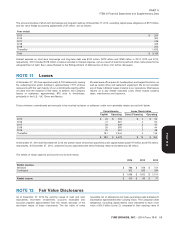
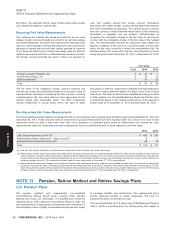
PART II
ITEM 8 Financial Statements and Supplementary Data
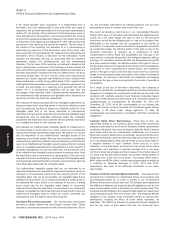
2016. This upfront loss largely contributed to a $70 million Refranchising not to be impaired as the fair value of the Pizza Hut UK reporting unit
loss we recognized during 2012 as a result of this refranchising. Also exceeded its carrying amount. For the year ended December 28, 2013, the
included in that loss was the write-off of $14 million in goodwill allocated to refranchising of the Pizza Hut UK dine-in restaurants decreased Company
the Pizza Hut UK reporting unit. The remaining carrying value of goodwill sales by 39% and increased Franchise and license fees and income and
allocated at that time to our Pizza Hut UK business of $87 million, Operating Profit by 3% and 6%, respectively, for the Pizza Hut Division
immediately subsequent to the aforementioned write-off, was determined versus 2012.
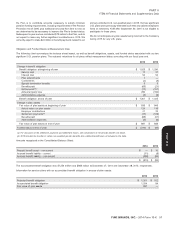
Store Closure and Impairment Activity
Store closure (income) costs and Store impairment charges by reportable segment are presented below. These tables exclude $463 million and
$295 million of Little Sheep impairment losses in 2014 and 2013, respectively which were not allocated to any segment for performance reporting
purposes.
2014
China KFC Pizza Hut Taco Bell India Worldwide
Store closure (income) costs(a) $— $2 $1 $— $— $ 3
Store impairment charges 54 7 4 3 1 69
Closure and impairment (income) expenses $ 54 $ 9 $ 5 $ 3 $ 1 $ 72
2013
China KFC Pizza Hut Taco Bell India Worldwide
Store closure (income) costs(a) $ (1) $ (1) $ (3) $ — $ — $ (5)
Store impairment charges 31 4 3 1 2 41
Closure and impairment (income) expenses $ 30 $ 3 $ — $ 1 $ 2 $ 36
2012
China KFC Pizza Hut Taco Bell India Worldwide
Store closure (income) costs(a) $(4) $ 1 $10 $1 $— $ 8
Store impairment charges 13 11 2 3 — 29
Closure and impairment (income) expenses $ 9 $ 12 $ 12 $ 4 $ — $ 37
(a) Store closure (income) costs include the net gain or loss on sales of real estate on which we formerly operated a Company-owned restaurant that was closed,
lease reserves established when we cease using a property under an operating lease and subsequent adjustments to those reserves and other facility-related
expenses from previously closed stores. Remaining lease obligations for closed stores were not material at December 27, 2014 or December 28, 2013.
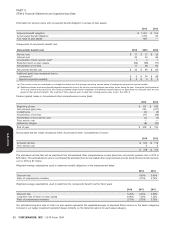
Supplemental Cash Flow Data
2014 2013 2012
Cash Paid For:
Interest(a) $ 149 $ 269 $ 166
Income taxes(b) 684 489 417
Significant Non-Cash Investing and Financing Activities:
Capital lease obligations incurred $ 24 $ 15 $ 17
Capital lease obligations relieved, primarily through divestitures and refranchisings 1 2 112
Increase in accrued capital expenditures 15 N/A 35
(a) 2013 includes $109 million of cash premiums and fees paid related to the extinguishment of debt, which is the primary component of the $120 million loss on debt
extinguishment. See Note 4.
(b) 2014 includes $200 million of cash paid related to the resolution of a valuation issue with the Internal Revenue Service related to years 2004-2008. See the
Internal Revenue Service Adjustments section of Note 16.
YUM! BRANDS, INC. - 2014 Form 10-K 51
NOTE 5
13MAR201516053226
Form 10-K