Pizza Hut 2014 Annual Report Download - page 112
Download and view the complete annual report
Please find page 112 of the 2014 Pizza Hut annual report below. You can navigate through the pages in the report by either clicking on the pages listed below, or by using the keyword search tool below to find specific information within the annual report.-
 1
1 -
2
-
3
-
4
-
5
-
6
-
7
-
8
-
9
-
10
-
11
-
12
-
13
-
14
-
15
-
16
-
17
-
18
-
19
-
20
-
21
-
22
-
23
-
24
-
25
-
26
-
27
-
28
-
29
-
30
-
31
-
32
-
33
-
34
-
35
-
36
-
37
-
38
-
39
-
40
-
41
-
42
-
43
-
44
-
45
-
46
-
47
-
48
-
49
-
50
-
51
-
52
-
53
-
54
-
55
-
56
-
57
-
58
-
59
-
60
-
61
-
62
-
63
-
64
-
65
-
66
-
67
-
68
-
69
-
70
-
71
-
72
-
73
-
74
-
75
-
76
-
77
-
78
-
79
-
80
-
81
-
82
-
83
-
84
-
85
-
86
-
87
-
88
-
89
-
90
-
91
-
92
-
93
-
94
-
95
-
96
-
97
-
98
-
99
-
100
-
101
-
 102
102 -
 103
103 -
 104
104 -
 105
105 -
 106
106 -
 107
107 -
 108
108 -
 109
109 -
 110
110 -
 111
111 -
 112
112 -
 113
113 -
 114
114 -
 115
115 -
 116
116 -
 117
117 -
 118
118 -
 119
119 -
 120
120 -
 121
121 -
 122
122 -
123
-
124
-
125
-
126
-
127
-
128
-
129
-
130
-
131
-
132
-
133
-
134
-
135
-
136
-
137
-
138
-
139
-
140
-
141
-
142
-
143
-
144
-
145
-
146
-
147
-
148
-
149
-
150
-
151
-
152
-
153
-
154
-
155
-
156
-
157
-
158
-
159
-
160
-
161
-
162
-
163
-
164
-
165
-
166
-
167
-
168
-
169
-
170
-
171
-
172
-
173
-
174
-
175
-
176
 |
 |

13MAR201517272138
PART II
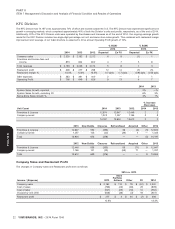
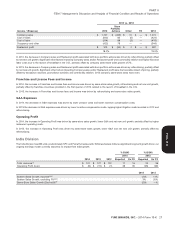
ITEM 7 Management’s Discussion and Analysis of Financial Condition and Results of Operations
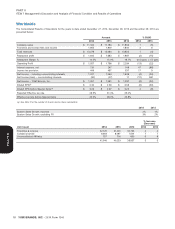
Worldwide
The Consolidated Results of Operations for the years to date ended December 27, 2014, December 28, 2013 and December 29, 2012 are
presented below:
Amount % B/(W)
2014 2013 2012 2014 2013
Company sales $ 11,324 $ 11,184 $ 11,833 1 (5)
Franchise and license fees and income 1,955 1,900 1,800 3 6
Total revenues $ 13,279 $ 13,084 $ 13,633 1 (4)
Restaurant profit $ 1,642 $ 1,683 $ 1,981 (2) (15)
Restaurant Margin % 14.5% 15.0% 16.7% (0.5) ppts. (1.7) ppts.
Operating Profit $ 1,557 $ 1,798 $ 2,294 (13) (22)
Interest expense, net 130 247 149 47 (66)
Income tax provision 406 487 537 17 9
Net Income – including noncontrolling interests 1,021 1,064 1,608 (4) (34)
Net Income (loss) – noncontrolling interests (30) (27) 11 (12) NM
Net Income – YUM! Brands, Inc. $ 1,051 $ 1,091 $ 1,597 (4) (32)
Diluted EPS(a) $ 2.32 $ 2.36 $ 3.38 (2) (30)
Diluted EPS before Special Items(a) $ 3.09 $ 2.97 $ 3.25 4 (9)
Reported Effective tax rate 28.5% 31.4% 25.0%
Effective tax rate before Special Items 25.5% 28.0% 25.8%
(a) See Note 3 for the number of shares used in these calculations.
2014 2013
System Sales Growth, reported 2% 1%
System Sales Growth, excluding FX 3% 2%
% Increase
(Decrease)
Unit Count 2014 2013 2012 2014 2013
Franchise & License 32,125 31,420 30,733 2 2
Company-owned 8,664 8,097 7,544 7 7
Unconsolidated Affiliates 757 716 660 6 8
41,546 40,233 38,937 3 3
18 YUM! BRANDS, INC. - 2014 Form 10-K
Form 10-K