Pizza Hut 2012 Annual Report Download - page 66
Download and view the complete annual report
Please find page 66 of the 2012 Pizza Hut annual report below. You can navigate through the pages in the report by either clicking on the pages listed below, or by using the keyword search tool below to find specific information within the annual report.-
 1
1 -
2
-
3
-
4
-
5
-
6
-
7
-
8
-
9
-
10
-
11
-
12
-
13
-
14
-
15
-
16
-
17
-
18
-
19
-
20
-
21
-
22
-
23
-
24
-
25
-
26
-
27
-
28
-
29
-
30
-
31
-
32
-
33
-
34
-
35
-
36
-
37
-
38
-
39
-
40
-
41
-
42
-
43
-
44
-
45
-
46
-
47
-
48
-
49
-
50
-
51
-
52
-
53
-
54
-
55
-
 56
56 -
 57
57 -
 58
58 -
 59
59 -
 60
60 -
 61
61 -
 62
62 -
 63
63 -
 64
64 -
 65
65 -
 66
66 -
 67
67 -
 68
68 -
 69
69 -
 70
70 -
 71
71 -
 72
72 -
 73
73 -
 74
74 -
 75
75 -
 76
76 -
77
-
78
-
79
-
80
-
81
-
82
-
83
-
84
-
85
-
86
-
87
-
88
-
89
-
90
-
91
-
92
-
93
-
94
-
95
-
96
-
97
-
98
-
99
-
100
-
101
-
102
-
103
-
104
-
105
-
106
-
107
-
108
-
109
-
110
-
111
-
112
-
113
-
114
-
115
-
116
-
117
-
118
-
119
-
120
-
121
-
122
-
123
-
124
-
125
-
126
-
127
-
128
-
129
-
130
-
131
-
132
-
133
-
134
-
135
-
136
-
137
-
138
-
139
-
140
-
141
-
142
-
143
-
144
-
145
-
146
-
147
-
148
-
149
-
150
-
151
-
152
-
153
-
154
-
155
-
156
-
157
-
158
-
159
-
160
-
161
-
162
-
163
-
164
-
165
-
166
-
167
-
168
-
169
-
170
-
171
-
172
 |
 |

YUM! BRANDS, INC.-2013Proxy Statement48
Proxy Statement
EXECUTIVE COMPENSATION
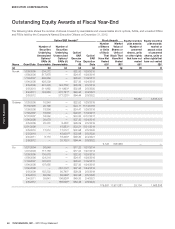
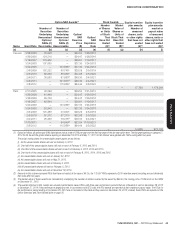
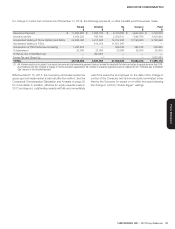
Outstanding Equity Awards at Fiscal Year-End
The following table shows the number of shares covered by exercisable and unexercisable stock options, SARs, and unvested RSUs
and PSUs held by the Company’s Named Executive Offi cers on December31,2012.
Name Grant Date
Option/SAR Awards(1) Stock Awards Equity incentive
plan awards:
Number of
unearned
shares, units
or other rights
that have not
vested
(#)(4)
Equity incentive
plan awards:
market or
payout value
of unearned
shares, units or
other rights that
have not vested
($)(3)
Number of
Securities
Underlying
Unexercised
Options/
SARs (#)
Exercisable
Number of
Securities
Underlying
Unexercised
Options/
SARs (#)
Unexercisable
Option/
SAR
Exercise
Price
($)
Option/
SAR
Expiration
Date
Number
of Shares
or Units
of Stock
That
Have Not
Vested
(#)(2)
Market
Value of
Shares or
Units of
Stock That
Have Not
Vested
($)(3)
(a)
(b) (c)
(d) (e) (f) (g) (h) (i)
Novak 1/28/2005 334,272 — $22.53 1/28/2015
1/26/2006 517,978 — $24.47 1/26/2016
1/19/2007 490,960 — $29.61 1/19/2017
1/24/2008 428,339 — $37.30 1/24/2018
2/5/2009 431,326 143,776(i) $29.29 2/5/2019
2/5/2010 311,962 311,963(ii) $32.98 2/5/2020
2/4/2011 124,063 372,191(iii) $49.30 2/4/2021
2/8/2012 — 377,328(iv) $64.44 2/8/2022
— — 55,352 3,675,373
Grismer 1/28/2005 10,840 — $22.53 1/28/2015
11/18/2005 20,190 — $24.11 11/18/2015
1/26/2006 18,856 — $24.47 1/26/2016
1/19/2007 19,938 — $29.61 1/19/2017
5/17/2007 16,262 — $33.20 5/17/2017
1/24/2008 20,079 — $37.30 1/24/2018
2/5/2009 25,372 8,458(i) $29.29 2/5/2019
5/21/2009 — 15,853(vi) $33.21 5/21/2019
2/5/2010 17,212 17,212(ii) $32.98 2/5/2020
2/5/2010 — 43,030(viii) $32.98 2/5/2020
2/4/2011 6,110 18,330(iii) $49.30 2/4/2021
2/8/2012 — 33,102(iv) $64.44 2/8/2022
9,126 605,966 — —
Su 1/27/2004 58,040 — $17.23 1/27/2014
1/27/2004 117,188 — $17.23 1/27/2014
1/28/2005 130,078 — $22.53 1/28/2015
1/26/2006 124,316 — $24.47 1/26/2016
1/19/2007 132,918 — $29.61 1/19/2017
1/24/2008 107,085 — $37.30 1/24/2018
1/24/2008 — 267,712(v) $37.30 1/24/2018
2/5/2009 152,232 50,745(i) $29.29 2/5/2019
2/5/2010 86,059 86,059(ii) $32.98 2/5/2020
2/4/2011 35,641 106,926(iii) $49.30 2/4/2021
2/8/2012 — 165,5 09(iv) $64.44 2/8/2022
179,697 11,931,881 25,134 1,668,898