Pizza Hut 2012 Annual Report Download - page 117
Download and view the complete annual report
Please find page 117 of the 2012 Pizza Hut annual report below. You can navigate through the pages in the report by either clicking on the pages listed below, or by using the keyword search tool below to find specific information within the annual report.-
 1
1 -
2
-
3
-
4
-
5
-
6
-
7
-
8
-
9
-
10
-
11
-
12
-
13
-
14
-
15
-
16
-
17
-
18
-
19
-
20
-
21
-
22
-
23
-
24
-
25
-
26
-
27
-
28
-
29
-
30
-
31
-
32
-
33
-
34
-
35
-
36
-
37
-
38
-
39
-
40
-
41
-
42
-
43
-
44
-
45
-
46
-
47
-
48
-
49
-
50
-
51
-
52
-
53
-
54
-
55
-
56
-
57
-
58
-
59
-
60
-
61
-
62
-
63
-
64
-
65
-
66
-
67
-
68
-
69
-
70
-
71
-
72
-
73
-
74
-
75
-
76
-
77
-
78
-
79
-
80
-
81
-
82
-
83
-
84
-
85
-
86
-
87
-
88
-
89
-
90
-
91
-
92
-
93
-
94
-
95
-
96
-
97
-
98
-
99
-
100
-
101
-
102
-
103
-
104
-
105
-
106
-
 107
107 -
 108
108 -
 109
109 -
 110
110 -
 111
111 -
 112
112 -
 113
113 -
 114
114 -
 115
115 -
 116
116 -
 117
117 -
 118
118 -
 119
119 -
 120
120 -
 121
121 -
 122
122 -
 123
123 -
 124
124 -
 125
125 -
 126
126 -
 127
127 -
128
-
129
-
130
-
131
-
132
-
133
-
134
-
135
-
136
-
137
-
138
-
139
-
140
-
141
-
142
-
143
-
144
-
145
-
146
-
147
-
148
-
149
-
150
-
151
-
152
-
153
-
154
-
155
-
156
-
157
-
158
-
159
-
160
-
161
-
162
-
163
-
164
-
165
-
166
-
167
-
168
-
169
-
170
-
171
-
172
 |
 |

YUM! BRANDS, INC.-2012 Form10-K 25
Form 10-K
PART II
ITEM7Management’s Discussion and Analysis ofFinancial Condition and Results ofOperations
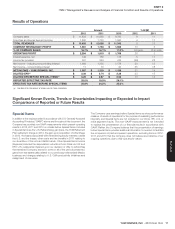
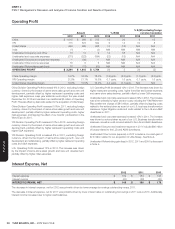
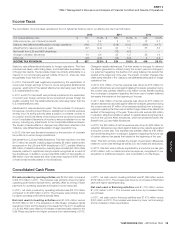
In 2012, theincrease in China Company sales associated with store portfolio
actions was primarily driven by new unit development and the acquisition
of Little Sheep, partially offset by restaurant closures. The increase in China
Restaurant profi t associated with store portfolio actions was primarily
driven by new unit development, partially offset by restaurant closures.
Signifi cant other factors impacting Company sales and/or Restaurant profi t
were Company same-store sales growth of 4%, which was partially offset
by wage rate infl ation of 10% and higher rent and utilities.
In 2011, theincrease in China Company sales and Restaurant profi t
associated with store portfolio actions was primarily driven by the
development of new units partially offset by lapping the benefi t of our
participation in the World Expo in 2010.Signifi cant other factors impacting
Company sales and/or Restaurant profi t were Company same-store sales
growth of 18% which was driven by transaction growth partially offset by
a negative impact from sales mix shift and a new business tax that took
effect December2010, wage rate infl ation of 20% as well as commodity
infl ation of $90million, or 8%.
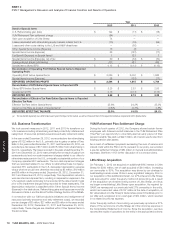
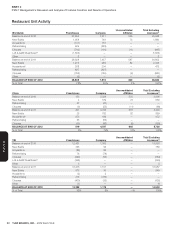
YRI
Income/(Expense)
2012 vs. 2011
2011
Store Portfolio
Actions Other FX
53rd Week
in 2011 2012
Company sales $ 2,341 $ 100 $ 72 $ (82) $ (29) $ 2,402
Cost of sales (743) (65) (18) 30 9 (787)
Cost of labor (608) (3) (15) 19 8 (599)
Occupancy and other (700) (16) (18) 23 6 (705)
RESTAURANT PROFIT $ 290 $ 16 $ 21 $ (10) $ (6) $ 311
Restaurant margin 12.4% 12.9%
Income/(Expense)
2011 vs. 2010
2010
Store Portfolio
Actions Other FX
53rd Week
in 2011 2011
Company sales $ 2,310 $ (171) $ 57 $ 116 $ 29 $ 2,341
Cost of sales (738) 77 (35) (38) (9) (743)
Cost of labor (587) 38 (21) (30) (8) (608)
Occupancy and other (711) 60 (10) (33) (6) (700)
RESTAURANT PROFIT $ 274 $ 4 $ (9) $ 15 $ 6 $ 290
Restaurant margin 11.8% 12.4%
In 2012, the increase in YRI Company sales and Restaurant profi t associated
with store portfolio actions was driven by the acquisition of restaurants
in South Africa in the fourth quarter of 2011 and new unit development,
partially offset by refranchising. Signifi cant other factors impacting Company
sales and/or Restaurant profi t were Company same-store sales growth
of 3%, which was offset by the combination of higher labor costs and
commodity infl ation.
In 2011, the decrease in YRI Company sales associated with store portfolio
actions was driven by refranchising, primarily Mexico, partially offset by
new unit development. Signifi cant other factors impacting Company sales
and/or Restaurant profi t were Company same-store sales growth of 3%
offset by commodity infl ation and higher labor costs.
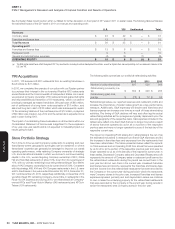
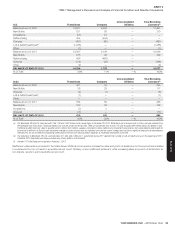
U.S.
Income/(Expense)
2012 vs. 2011
2011
Store Portfolio
Actions Other
53rd Week in
2011 2012
Company sales $ 3,000 $ (535) $ 128 $ (43) $ 2,550
Cost of sales (917) 177 (13) 13 (740)
Cost of labor (912) 165 (16) 12 (751)
Occupancy and other (809) 164 (7) 9 (643)
RESTAURANT PROFIT $ 362 $ (29) $ 92 $ (9) $ 416
Restaurant margin 12.1% 16.3%