Pizza Hut 2012 Annual Report Download - page 54
Download and view the complete annual report
Please find page 54 of the 2012 Pizza Hut annual report below. You can navigate through the pages in the report by either clicking on the pages listed below, or by using the keyword search tool below to find specific information within the annual report.-
 1
1 -
2
-
3
-
4
-
5
-
6
-
7
-
8
-
9
-
10
-
11
-
12
-
13
-
14
-
15
-
16
-
17
-
18
-
19
-
20
-
21
-
22
-
23
-
24
-
25
-
26
-
27
-
28
-
29
-
30
-
31
-
32
-
33
-
34
-
35
-
36
-
37
-
38
-
39
-
40
-
41
-
42
-
43
-
 44
44 -
 45
45 -
 46
46 -
 47
47 -
 48
48 -
 49
49 -
 50
50 -
 51
51 -
 52
52 -
 53
53 -
 54
54 -
 55
55 -
 56
56 -
 57
57 -
 58
58 -
 59
59 -
 60
60 -
 61
61 -
 62
62 -
 63
63 -
 64
64 -
65
-
66
-
67
-
68
-
69
-
70
-
71
-
72
-
73
-
74
-
75
-
76
-
77
-
78
-
79
-
80
-
81
-
82
-
83
-
84
-
85
-
86
-
87
-
88
-
89
-
90
-
91
-
92
-
93
-
94
-
95
-
96
-
97
-
98
-
99
-
100
-
101
-
102
-
103
-
104
-
105
-
106
-
107
-
108
-
109
-
110
-
111
-
112
-
113
-
114
-
115
-
116
-
117
-
118
-
119
-
120
-
121
-
122
-
123
-
124
-
125
-
126
-
127
-
128
-
129
-
130
-
131
-
132
-
133
-
134
-
135
-
136
-
137
-
138
-
139
-
140
-
141
-
142
-
143
-
144
-
145
-
146
-
147
-
148
-
149
-
150
-
151
-
152
-
153
-
154
-
155
-
156
-
157
-
158
-
159
-
160
-
161
-
162
-
163
-
164
-
165
-
166
-
167
-
168
-
169
-
170
-
171
-
172
 |
 |

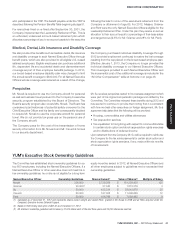
YUM! BRANDS, INC.-2013Proxy Statement36
Proxy Statement
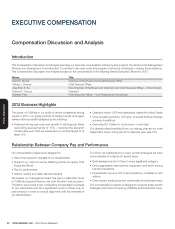
EXECUTIVE COMPENSATION
is based on our belief that the correct calibration of complexity and
responsibility (and therefore market values) lies between corporate-
reported (or divisional) revenues and system wide revenues. The
application of this philosophy means that, for purposes of the
2012 benchmarking, the Company, when considering franchisee
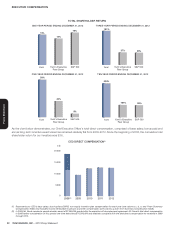
sales, was viewed as having estimated revenues of $18.3billion.
Specifi cally, this amount was determined by adding 2011 estimated
Company sales of $10.7billion and 25% of estimated franchisee
and licensee sales (from which the Company derives revenues
in the form of royalties) of $30.5billion. (Revenue from 2010 was
used for peer companies since the benchmarking was prepared
at the end of 2011 for making pay decisions in 2012 and at that
time the most recent publicly available information for all of the
peer companies dated from year-end 2010.)
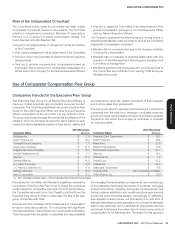
Comparator Compensation Data
One of the factors our Committee uses in setting executive
compensation is an evaluation of how our target and actual
compensation levels compare to those of similarly situated
executives in our Executive Peer Group. The Company has a
philosophy for its Named Executive Offi cers (other than for the CEO)
to target the 50th to 75th percentile for base salary, 75th percentile for
target bonus and 50
th
percentile for long-term incentives. For the
Chief Executive Offi cer, the Company generally attempts to deliver
pay at the 75
th
percentile of the market if he and the Company
have superior performance, specifi cally, 75th percentile total cash
and total direct compensation. For 2012, his total compensation
was slightly below the 75th percentile.
Meridian provided the Executive Peer Group compensation data
to the Committee and it was used as a frame of reference for
establishing compensation targets for base salary, annual bonus
and long-term incentives for all of the Named Executive Offi cers.
The Committee uses this market information as a point of reference
in considering potential compensation decisions. However, this is
not the only factor considered for our Named Executive Offi cers’
compensation, and it does not supplant the analyses of the individual
performance of all of the Named Executive Offi cers. Because the
comparative compensation information is one of several factors
used in the setting of executive compensation, the Committee
applies discretion in determining the nature and extent of its use.
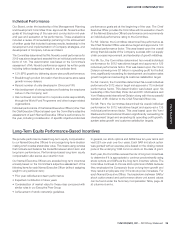
Decisions Impacting Chief Executive Offi cer 2012 Pay
For 2012, the Committee determined that our Chief Executive
Offi cer’s base salary, target bonus and long-term incentive target
were competitive as compared to our Executive Peer Group and
it did not increase any of these elements.
In January2012, the Committee made the following changes for
the Chief Executive Offi cer in order to ensure actual pay refl ects our
target pay philosophy:
•
Consideration of Actual Bonus Paid – Used actual bonus paid
rather than target bonus when benchmarking pay opportunities
with the Executive Peer Group.
•
Determin ation of Stock Appreciation Rights – Determin ed the
amount of his stock appreciation rights using an expected grant
date fair value based on the full term rather than the expected
term as this refl ected the actual historical holding periods for
stock appreciation rights grants to our Chief Executive Offi cer
and, therefore, a more appropriate method of determin ing the
award amount.
Effective January 1, 2012, the Committee discontinued Mr. Novak’s
accruing nonqualified pension benefits under the Pension
Equalization Plan (PEP) and, effective January 1, 2013, replaced
his PEP benefi t with a pension account determined under the
Leadership Retirement Plan. The Committee made this change
to provide Mr. Novak a long term benefi t that is similar to what
he would have received under PEP assuming historically normal
interest rates, and to provide him an annual benefi t amount that
will not fl uctuate from year-to-year due to interest rate volatility.
Beginning in 2013, Mr. Novak will receive an allocation to his
pension account equal to 9.5% of his salary and target bonus and
will receive an annual interest allocation on his account balance
equal to 120% of the applicable federal rate. (See footnote (5) to
the Summary Compensation Table at page 45 for more detail.)
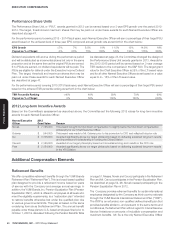
Base Salary
We pay base salary to compensate our Named Executive Offi cers
for their primary roles and responsibilities and to provide a stable
level of annual compensation. A Named Executive Offi cer’s actual
salary varies based on the role, level of his responsibility, experience,
individual performance, future potential and market value. Specifi c
salary increases take into account these factors. In addition, salary
increases may be warranted based on a promotion or change in
the responsibilities of the Named Executive Offi cer. The Committee
reviews the Named Executive Offi cers’ salary and performance
annually.