Pizza Hut 2012 Annual Report Download - page 159
Download and view the complete annual report
Please find page 159 of the 2012 Pizza Hut annual report below. You can navigate through the pages in the report by either clicking on the pages listed below, or by using the keyword search tool below to find specific information within the annual report.-
 1
1 -
2
-
3
-
4
-
5
-
6
-
7
-
8
-
9
-
10
-
11
-
12
-
13
-
14
-
15
-
16
-
17
-
18
-
19
-
20
-
21
-
22
-
23
-
24
-
25
-
26
-
27
-
28
-
29
-
30
-
31
-
32
-
33
-
34
-
35
-
36
-
37
-
38
-
39
-
40
-
41
-
42
-
43
-
44
-
45
-
46
-
47
-
48
-
49
-
50
-
51
-
52
-
53
-
54
-
55
-
56
-
57
-
58
-
59
-
60
-
61
-
62
-
63
-
64
-
65
-
66
-
67
-
68
-
69
-
70
-
71
-
72
-
73
-
74
-
75
-
76
-
77
-
78
-
79
-
80
-
81
-
82
-
83
-
84
-
85
-
86
-
87
-
88
-
89
-
90
-
91
-
92
-
93
-
94
-
95
-
96
-
97
-
98
-
99
-
100
-
101
-
102
-
103
-
104
-
105
-
106
-
107
-
108
-
109
-
110
-
111
-
112
-
113
-
114
-
115
-
116
-
117
-
118
-
119
-
120
-
121
-
122
-
123
-
124
-
125
-
126
-
127
-
128
-
129
-
130
-
131
-
132
-
133
-
134
-
135
-
136
-
137
-
138
-
139
-
140
-
141
-
142
-
143
-
144
-
145
-
146
-
147
-
148
-
 149
149 -
 150
150 -
 151
151 -
 152
152 -
 153
153 -
 154
154 -
 155
155 -
 156
156 -
 157
157 -
 158
158 -
 159
159 -
 160
160 -
 161
161 -
 162
162 -
 163
163 -
 164
164 -
 165
165 -
 166
166 -
 167
167 -
 168
168 -
 169
169 -
170
-
171
-
172
 |
 |

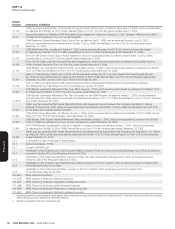
YUM! BRANDS, INC.-2012 Form10-K 67
Form 10-K
PART II
ITEM 8Financial Statements andSupplementaryData
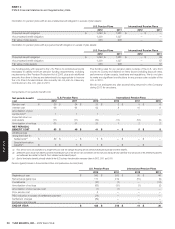
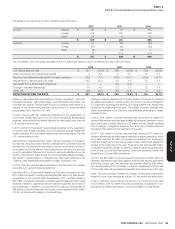
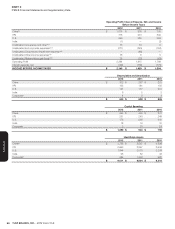
Long-Lived Assets(j)
2012 2011 2010
China $ 2,779 $ 1,546 $ 1,269
YRI 1,561 1,600 1,523
U.S. 1,555 1,805 2,095
India 47 35 25
Corporate 32 36 52
$ 5,974 $ 5,022 $ 4,964
(a) Amounts have not been allocated to the U.S., YRI or China Division segments for performance reporting purposes.
(b) Includes equity income from investments inunconsolidated affiliates of $47million, $47million and $42million in 2012, 2011 and 2010, respectively, for China.
(c) 2012, 2011 and 2010 include depreciation reductions arising from the impairment of KFC restaurants we offered to sell of $3million, $10million and $9million, respectively. 2012 and
2011 include depreciation reductions arising from the impairment of Pizza Hut UK restaurants we decided to sell in 2011 of $13million and $3million, respectively.See Note4.
(d) 2012 includes the YUM Retirement Plan settlement charge of $84million. 2012, 2011 and 2010 include approximately $5million, $21million and $9million, respectively, of charges
relating to U.S. general and administrative productivity initiatives and realignment of resources.See Note4.
(e) 2011 represents net losses resulting from the LJS and A&W divestitures. See Note4.
(f) 2012 includes gain upon acquisition of Little Sheep of $74million. See Note4.
(g) See Note4 for further discussion of Refranchising gain (loss).
(h) China includes investments in 3 unconsolidated affiliates totaling $72 million for 2012 and 4 unconsolidated affiliates totaling $167 million and $154 million, for 2011 and 2010,
respectively.
(i) Primarily includes cash, deferred tax assets and property, plant and equipment, net, related to our office facilities. 2011 includes $300million of restricted cash related to the Little Sheep
acquisition.
(j) Includes property, plant and equipment, net, goodwill, and intangible assets, net.
See Note4 for additional operating segment disclosures related to impairment and store closure (income) costs.
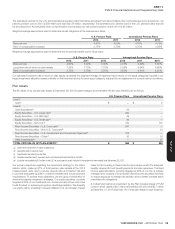
NOTE19 Contingencies
Lease Guarantees
As a result of (a) assigning our interest in obligations under real estate
leases as a condition to the refranchising of certain Company restaurants;
(b) contributing certain Company restaurants to unconsolidated affi liates;
and (c) guaranteeing certain other leases, we are frequently contingently
liable on lease agreements.These leases have varying terms, the latest
of which expires in 2066.As of December29, 2012, the potential amount
of undiscounted payments we could be required to make in the event of
non-payment by the primary lessee was approximately $750million.The
present value of these potential payments discounted at our pre-tax
cost of debt at December29, 2012 was approximately $675million.Our
franchisees are the primary lessees under the vast majority of these
leases.We generally have cross-default provisions with these franchisees
that would put them in default of their franchise agreement in the event of
non-payment under the lease.We believe these cross-default provisions
signifi cantly reduce the risk that we will be required to make payments
under these leases.Accordingly, the liability recorded for our probable
exposure under such leases at December29, 2012 and December31,
2011 was not material.
Franchise Loan Pool and Equipment
Guarantees
We have agreed to provide fi nancial support, if required, to a variable
interest entity that operates a franchisee lending program used primarily
to assist franchisees in the development of new restaurants in the U.S.
and, to a lesser extent, in connection with the Company’s refranchising
programs.We have provided guarantees of approximately $37million in
support of the franchisee loan program at December29, 2012.The total
loans outstanding under the loan pool were $53million at December29,
2012 with an additional $27million available for lending at December29,
2012.We have determined that we are not required to consolidate this
entity as we share the power to direct this entity’s lending activity with
other parties.
In addition to the guarantees described above, YUM has provided guarantees
of $54million on behalf of franchisees for several fi nancing programs related
to specifi c initiatives.The total loans outstanding under these fi nancing
programs were approximately $72million at December29, 2012.
Unconsolidated Affi liates Guarantees
From time to time we have guaranteed certain lines of credit and loans of
unconsolidated affi liates.At December29, 2012 there are no guarantees
outstanding for unconsolidated affi liates.Our unconsolidated affi liates had
total revenues of approximately $1.2billion for the year ended December29,
2012 and assets and debt of approximately $355million and $60million,
respectively, at December29, 2012.
Insurance Programs
We are self-insured for a substantial portion of our current and prior years’
coverage including property and casualty losses.To mitigate the cost of
our exposures for certain property and casualty losses, we self-insure
the risks of loss up to defi ned maximum per occurrence retentions on a
line-by-line basis.The Company then purchases insurance coverage, up
to a certain limit, for losses that exceed the self-insurance per occurrence
retention.The insurers’ maximum aggregate loss limits are signifi cantly
above our actuarially determined probable losses; therefore, we believe
the likelihood of losses exceeding the insurers’ maximum aggregate loss
limits is remote.