Pizza Hut 2012 Annual Report Download - page 151
Download and view the complete annual report
Please find page 151 of the 2012 Pizza Hut annual report below. You can navigate through the pages in the report by either clicking on the pages listed below, or by using the keyword search tool below to find specific information within the annual report.-
 1
1 -
2
-
3
-
4
-
5
-
6
-
7
-
8
-
9
-
10
-
11
-
12
-
13
-
14
-
15
-
16
-
17
-
18
-
19
-
20
-
21
-
22
-
23
-
24
-
25
-
26
-
27
-
28
-
29
-
30
-
31
-
32
-
33
-
34
-
35
-
36
-
37
-
38
-
39
-
40
-
41
-
42
-
43
-
44
-
45
-
46
-
47
-
48
-
49
-
50
-
51
-
52
-
53
-
54
-
55
-
56
-
57
-
58
-
59
-
60
-
61
-
62
-
63
-
64
-
65
-
66
-
67
-
68
-
69
-
70
-
71
-
72
-
73
-
74
-
75
-
76
-
77
-
78
-
79
-
80
-
81
-
82
-
83
-
84
-
85
-
86
-
87
-
88
-
89
-
90
-
91
-
92
-
93
-
94
-
95
-
96
-
97
-
98
-
99
-
100
-
101
-
102
-
103
-
104
-
105
-
106
-
107
-
108
-
109
-
110
-
111
-
112
-
113
-
114
-
115
-
116
-
117
-
118
-
119
-
120
-
121
-
122
-
123
-
124
-
125
-
126
-
127
-
128
-
129
-
130
-
131
-
132
-
133
-
134
-
135
-
136
-
137
-
138
-
139
-
140
-
 141
141 -
 142
142 -
 143
143 -
 144
144 -
 145
145 -
 146
146 -
 147
147 -
 148
148 -
 149
149 -
 150
150 -
 151
151 -
 152
152 -
 153
153 -
 154
154 -
 155
155 -
 156
156 -
 157
157 -
 158
158 -
 159
159 -
 160
160 -
 161
161 -
162
-
163
-
164
-
165
-
166
-
167
-
168
-
169
-
170
-
171
-
172
 |
 |

YUM! BRANDS, INC.-2012 Form10-K 59
Form 10-K
PART II
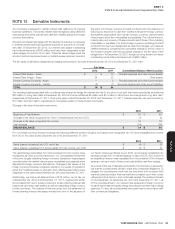
ITEM 8Financial Statements andSupplementaryData
The estimated net loss for the U.S. and International pension plans that will be amortized from Accumulated other comprehensive income (loss) into net
periodic pension cost in 2013 is $58million and less than $1million, respectively.The estimated prior service cost for the U.S. pension plans that will
be amortized from Accumulated other comprehensive income (loss) into net periodic pension cost in 2013 is $2million.
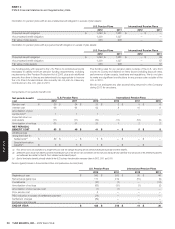
Weighted-average assumptions used to determine benefi t obligations at the measurement dates:
U.S. Pension Plans International Pension Plans
2012 2011 2012 2011
Discount rate 4.40% 4.90% 4.70 % 4.75%
Rate of compensation increase 3.75% 3.75% 3.70 % 3.85%
Weighted-average assumptions used to determine the net periodic benefi t cost for fi scal years:
U.S. Pension Plans International Pension Plans
2012 2011 2010 2012 2011 2010
Discount rate 4.90% 5.90% 6.30% 4.75% 5.40% 5.50%
Long-term rate of return on plan assets 7.25% 7.75% 7.75% 5.55% 6.64% 6.66%
Rate of compensation increase 3.75% 3.75% 3.75% 3.85% 4.41% 4.42%
Our estimated long-term rate of return on plan assets represents the weighted-average of expected future returns on the asset categories included in our
target investment allocation based primarily on the historical returns for each asset category, adjusted for an assessment of current market conditions.
Plan Assets
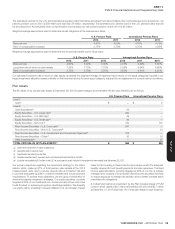
The fair values of our pension plan assets at December29, 2012 by asset category and level within the fair value hierarchy are as follows:
U.S. Pension Plans International Pension Plans
Level 1:
Cash(a) $—$ 9
Level 2:
Cash Equivalents(a) 42 —
Equity Securities – U.S. Large cap(b) 290 —
Equity Securities – U.S. Mid cap(b) 49 —
Equity Securities – U.S. Small cap(b) 49 —
Equity Securities – Non-U.S.(b) 100 131
Fixed Income Securities – U.S. Corporate(b) 247 —
Fixed Income Securities – Non-U.S. Corporate(b) — 33
Fixed Income Securities – U.S. Government and Government Agencies(c) 153 —
Fixed Income Securities – Other(d) 30 16
Other Investments(b) — 37
TOTAL FAIR VALUE OF PLAN ASSETS(e) $ 960 $ 226
(a) Short-term investments in money market funds
(b) Securities held in common trusts
(c) Investments held directly by the Plan
(d) Includes securities held in common trusts and investments held directly by the Plan
(e) Excludes net payable of $15million in the U.S. for purchases of assets included in the above that were settled after December29, 2012
Our primary objectives regarding the investment strategy for the Plan’s
assets, which make up 81% of total pension plan assets at the 2012
measurement date, are to reduce interest rate and market risk and
to provide adequate liquidity to meet immediate and future payment
requirements.To achieve these objectives, we are using a combination of
active and passive investment strategies.Our equity securities, currently
targeted at 55% of our investment mix, consist primarily of low-cost index
funds focused on achieving long-term capital appreciation.We diversify
our equity risk by investing in several different U.S. and foreign market
index funds.Investing in these index funds provides us with the adequate
liquidity required to fund benefi t payments and plan expenses.The fi xed
income asset allocation, currently targeted at 45% of our mix, is actively
managed and consists of long-duration fi xed income securities that help
to reduce exposure to interest rate variation and to better correlate asset
maturities with obligations.
A mutual fund held as an investment by the Plan includes shares of YUM
common stock valued at $0.7million at December29, 2012 and $0.7million
at December31, 2011 (less than 1% of total plan assets in each instance).