Pizza Hut 2012 Annual Report Download - page 109
Download and view the complete annual report
Please find page 109 of the 2012 Pizza Hut annual report below. You can navigate through the pages in the report by either clicking on the pages listed below, or by using the keyword search tool below to find specific information within the annual report.-
 1
1 -
2
-
3
-
4
-
5
-
6
-
7
-
8
-
9
-
10
-
11
-
12
-
13
-
14
-
15
-
16
-
17
-
18
-
19
-
20
-
21
-
22
-
23
-
24
-
25
-
26
-
27
-
28
-
29
-
30
-
31
-
32
-
33
-
34
-
35
-
36
-
37
-
38
-
39
-
40
-
41
-
42
-
43
-
44
-
45
-
46
-
47
-
48
-
49
-
50
-
51
-
52
-
53
-
54
-
55
-
56
-
57
-
58
-
59
-
60
-
61
-
62
-
63
-
64
-
65
-
66
-
67
-
68
-
69
-
70
-
71
-
72
-
73
-
74
-
75
-
76
-
77
-
78
-
79
-
80
-
81
-
82
-
83
-
84
-
85
-
86
-
87
-
88
-
89
-
90
-
91
-
92
-
93
-
94
-
95
-
96
-
97
-
98
-
 99
99 -
 100
100 -
 101
101 -
 102
102 -
 103
103 -
 104
104 -
 105
105 -
 106
106 -
 107
107 -
 108
108 -
 109
109 -
 110
110 -
 111
111 -
 112
112 -
 113
113 -
 114
114 -
 115
115 -
 116
116 -
 117
117 -
 118
118 -
 119
119 -
120
-
121
-
122
-
123
-
124
-
125
-
126
-
127
-
128
-
129
-
130
-
131
-
132
-
133
-
134
-
135
-
136
-
137
-
138
-
139
-
140
-
141
-
142
-
143
-
144
-
145
-
146
-
147
-
148
-
149
-
150
-
151
-
152
-
153
-
154
-
155
-
156
-
157
-
158
-
159
-
160
-
161
-
162
-
163
-
164
-
165
-
166
-
167
-
168
-
169
-
170
-
171
-
172
 |
 |

YUM! BRANDS, INC.-2012 Form10-K 17
Form 10-K
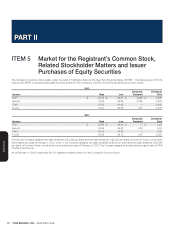
PART II
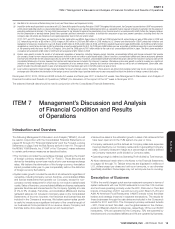
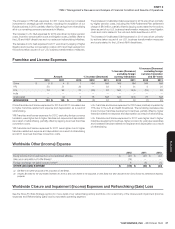
ITEM7Management’s Discussion and Analysis ofFinancial Condition and Results ofOperations
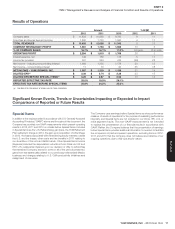
Results of Operations
Amount % B/(W)
2012 2011 2010 2012 2011
Company sales $ 11,833 $ 10,893 $ 9,783 9 11
Franchise and license fees and income 1,800 1,733 1,560 4 11
TOTAL REVENUES $ 13,633 $ 12,626 $ 11,343 8 11
COMPANY RESTAURANT PROFIT $ 1,981 $ 1,753 $ 1,663 13 6
% OF COMPANY SALES 16.7% 16.1% 17.0% 0.6 ppts. (0.9 ) ppts.
OPERATING PROFIT $ 2,294 $ 1,815 $ 1,769 26 3
Interest expense, net 149 156 175 5 11
Income tax provision 537 324 416 (66) 22
Net Income – including noncontrolling interest 1,608 1,335 1,178 20 13
Net Income – noncontrolling interest 11 16 20 35 18
NET INCOME – YUM! BRANDS, INC. $ 1,597 $ 1,319 $ 1,158 21 14
DILUTED EPS(a) $ 3.38 $ 2.74 $ 2.38 23 15
DILUTED EPS BEFORE SPECIAL ITEMS(a ) $ 3.25 $ 2.87 $ 2.53 13 14
REPORTED EFFECTIVE TAX RATE 25.0% 19.5% 26.1%
EFFECTIVE TAX RATE BEFORE SPECIAL ITEMS 25.8% 24.2% 25.3%
(a) See Note3 for the number of shares used in these calculations.
Signifi cant Known Events, Trends or Uncertainties Impacting or Expected to Impact
Comparisons of Reported or Future Results
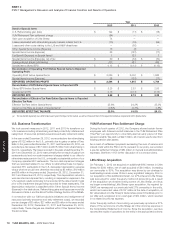
Special Items
In addition to the results provided in accordance with U.S. Generally Accepted
Accounting Principles (“GAAP”) above and throughout this document, the
Company has provided non-GAAP measurements which present operating
results in 2012, 2011 and 2010 on a basis before Special Items.Included
in Special Items are the U.S. Refranchising gain (loss), the YUM Retirement
Plan settlement charge in 2012, the gain upon acquisition of Little Sheep
in 2012, the losses associated with refranchising equity markets outside
the U.S. and the losses, other costs and tax benefi ts in 2011 relating to
our divestiture of the LJS and A&W brands. Other Special Items Income
(Expense) includes the depreciation reductions from Pizza Hut UK and
KFC U.S. restaurants impaired upon our decision or offer to refranchise
that remained Company stores for some or all of the periods presented,
gains from real estate sales related to our previously refranchised Mexico
business and charges relating to U.S. G&A productivity initiatives and
realignment of resources.
The Company uses earnings before Special Items as a key performance
measure of results of operations for the purpose of evaluating performance
internally, and Special Items are not included in our China, YRI, U.S. or
India segment results.This non-GAAP measurement is not intended
to replace the presentation of our fi nancial results in accordance with
GAAP.Rather, the Company believes that the presentation of earnings
before Special Items provides additional information to investors to facilitate
the comparison of past and present operations, excluding items in 2012,
2011 and 2010 that the Company does not believe are indicative of our
ongoing operations due to their size and/or nature.