Pizza Hut 2012 Annual Report Download - page 116
Download and view the complete annual report
Please find page 116 of the 2012 Pizza Hut annual report below. You can navigate through the pages in the report by either clicking on the pages listed below, or by using the keyword search tool below to find specific information within the annual report.-
 1
1 -
2
-
3
-
4
-
5
-
6
-
7
-
8
-
9
-
10
-
11
-
12
-
13
-
14
-
15
-
16
-
17
-
18
-
19
-
20
-
21
-
22
-
23
-
24
-
25
-
26
-
27
-
28
-
29
-
30
-
31
-
32
-
33
-
34
-
35
-
36
-
37
-
38
-
39
-
40
-
41
-
42
-
43
-
44
-
45
-
46
-
47
-
48
-
49
-
50
-
51
-
52
-
53
-
54
-
55
-
56
-
57
-
58
-
59
-
60
-
61
-
62
-
63
-
64
-
65
-
66
-
67
-
68
-
69
-
70
-
71
-
72
-
73
-
74
-
75
-
76
-
77
-
78
-
79
-
80
-
81
-
82
-
83
-
84
-
85
-
86
-
87
-
88
-
89
-
90
-
91
-
92
-
93
-
94
-
95
-
96
-
97
-
98
-
99
-
100
-
101
-
102
-
103
-
104
-
105
-
 106
106 -
 107
107 -
 108
108 -
 109
109 -
 110
110 -
 111
111 -
 112
112 -
 113
113 -
 114
114 -
 115
115 -
 116
116 -
 117
117 -
 118
118 -
 119
119 -
 120
120 -
 121
121 -
 122
122 -
 123
123 -
 124
124 -
 125
125 -
 126
126 -
127
-
128
-
129
-
130
-
131
-
132
-
133
-
134
-
135
-
136
-
137
-
138
-
139
-
140
-
141
-
142
-
143
-
144
-
145
-
146
-
147
-
148
-
149
-
150
-
151
-
152
-
153
-
154
-
155
-
156
-
157
-
158
-
159
-
160
-
161
-
162
-
163
-
164
-
165
-
166
-
167
-
168
-
169
-
170
-
171
-
172
 |
 |

YUM! BRANDS, INC.-2012 Form10-K 24
Form 10-K
PART II
ITEM7Management’s Discussion and Analysis ofFinancial Condition and Results ofOperations
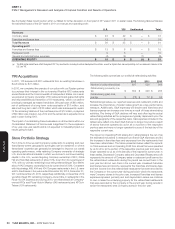
System Sales Growth
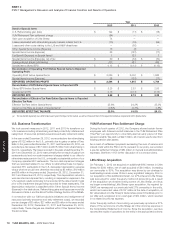
The following tables detail the key drivers of system sales growth for each reportable segment by year.Net unit growth represents the net impact of
actual system sales growth due to new unit openings and historical system sales lost due to closures as well as any necessary rounding.
2012 vs. 2011
China YRI U.S. India Worldwide
Same store sales growth (decline) 4% 3% 5% 5% 4%
Net unit growth and other(a) 16 3 (4) 24 2
Foreign currency translation 3 (3) N/A (16) (1)
53rd week in 2011 N/A (1) (2) N/A (1)
% CHANGE 23% 2% (1)% 13% 4%
% CHANGE, EXCLUDING FOREX
AND 53RD WEEK IN 2011 20% 6% —% 29% 6%
2011 vs. 2010
China YRI U.S. India Worldwide
Same store sales growth (decline) 19% 2% (1)% 10% 3%
Net unit growth and other 10 4 (1) 25 3
Foreign currency translation 6 5 N/A 1 3
53rd week in 2011 N/A 1 2 N/A 1
% CHANGE 35% 12% —% 36% 10%
% CHANGE, EXCLUDING FOREX
AND 53RD WEEK IN 2011 29% 6% (2)% 35% 6%
(a) For the year ended December29, 2012, system sales growth includes a 1% and 5% negative impact for YRI and the U.S., respectively, related to the LJS and A&W divestitures and a 3% positive
impact for China related to the acquisition of Little Sheep. Combined these items had a 2% net negative impact for Worldwide system sales for the year to date ended December29, 2012.
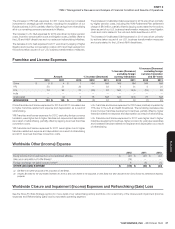
Company-Operated Store Results
The following tables detail the key drivers of the year-over-year changes
of Company sales and Restaurant profi t for each reportable segment by
year.Store portfolio actions represent the net impact of new unit openings,
acquisitions, refranchisings and store closures on Company sales or
Restaurant profi t.The impact of new unit openings and acquisitions
represent the actual Company sales or Restaurant profi t for the periods
the Company operated the restaurants in the current year but did not
operate them in the prior year.The impact of refranchisings and store
closures represent the actual Company sales or Restaurant profi t for the
periods in the prior year while the Company operated the restaurants but
did not operate them in the current year.
The dollar changes in Company Restaurant profi t by year were as follows:
China
2012 vs. 2011
Income/(Expense) 2011
Store Portfolio
Actions Other FX 2012
Company sales $ 5,487 $ 910 $ 249 $ 151 $ 6,797
Cost of sales (1,947) (318) 3 (50) (2,312)
Cost of labor (890) (207) (134) (28) (1,259)
Occupancy and other (1,568) (336) (45) (44) (1,993)
RESTAURANT PROFIT $ 1,082 $ 49 $ 73 $ 29 $ 1,233
Restaurant margin 19.7% 18.1%
Income/(Expense)
2011 vs. 2010
2010
Store Portfolio
Actions Other FX 2011
Company sales $ 4,081 $ 436 $ 720 $ 250 $ 5,487
Cost of sales (1,362) (150) (346) (89) (1,947)
Cost of labor (587) (96) (166) (41) (890)
Occupancy and other (1,231) (159) (107) (71) (1,568)
RESTAURANT PROFIT $ 901 $ 31 $ 101 $ 49 $ 1,082
Restaurant margin 22.1% 19.7%