Pizza Hut 2012 Annual Report Download - page 130
Download and view the complete annual report
Please find page 130 of the 2012 Pizza Hut annual report below. You can navigate through the pages in the report by either clicking on the pages listed below, or by using the keyword search tool below to find specific information within the annual report.-
 1
1 -
2
-
3
-
4
-
5
-
6
-
7
-
8
-
9
-
10
-
11
-
12
-
13
-
14
-
15
-
16
-
17
-
18
-
19
-
20
-
21
-
22
-
23
-
24
-
25
-
26
-
27
-
28
-
29
-
30
-
31
-
32
-
33
-
34
-
35
-
36
-
37
-
38
-
39
-
40
-
41
-
42
-
43
-
44
-
45
-
46
-
47
-
48
-
49
-
50
-
51
-
52
-
53
-
54
-
55
-
56
-
57
-
58
-
59
-
60
-
61
-
62
-
63
-
64
-
65
-
66
-
67
-
68
-
69
-
70
-
71
-
72
-
73
-
74
-
75
-
76
-
77
-
78
-
79
-
80
-
81
-
82
-
83
-
84
-
85
-
86
-
87
-
88
-
89
-
90
-
91
-
92
-
93
-
94
-
95
-
96
-
97
-
98
-
99
-
100
-
101
-
102
-
103
-
104
-
105
-
106
-
107
-
108
-
109
-
110
-
111
-
112
-
113
-
114
-
115
-
116
-
117
-
118
-
119
-
 120
120 -
 121
121 -
 122
122 -
 123
123 -
 124
124 -
 125
125 -
 126
126 -
 127
127 -
 128
128 -
 129
129 -
 130
130 -
 131
131 -
 132
132 -
 133
133 -
 134
134 -
 135
135 -
 136
136 -
 137
137 -
 138
138 -
 139
139 -
 140
140 -
141
-
142
-
143
-
144
-
145
-
146
-
147
-
148
-
149
-
150
-
151
-
152
-
153
-
154
-
155
-
156
-
157
-
158
-
159
-
160
-
161
-
162
-
163
-
164
-
165
-
166
-
167
-
168
-
169
-
170
-
171
-
172
 |
 |

YUM! BRANDS, INC.-2012 Form10-K 38
Form 10-K
PART II
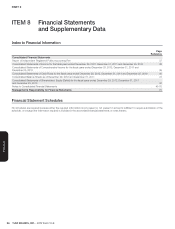
ITEM 8Financial Statements andSupplementaryData
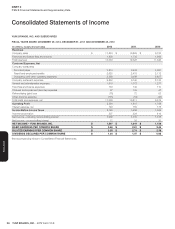
Consolidated Statements of Income
YUM! BRANDS, INC. AND SUBSIDIARIES
FISCAL YEARS ENDED DECEMBER29, 2012, DECEMBER31, 2011 AND DECEMBER25, 2010
(in millions, except per share data)
2012 2011 2010
Revenues
Company sales $ 11,833 $ 10,893 $ 9,783
Franchise and license fees and income 1,800 1,733 1,560
Total revenues 13,633 12,626 11,343
Costs and Expenses, Net
Company restaurants
Food and paper 3,874 3,633 3,091
Payroll and employee benefi ts 2,620 2,418 2,172
Occupancy and other operating expenses 3,358 3,089 2,857
Company restaurant expenses 9,852 9,140 8,120
General and administrative expenses 1,510 1,372 1,277
Franchise and license expenses 133 145 110
Closures and impairment (income) expenses 37 135 47
Refranchising (gain) loss (78) 72 63
Other (income) expense (115) (53) (43)
Total costs and expenses, net 11,339 10,811 9,574
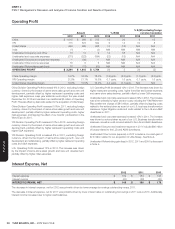
Operating Profi t 2,294 1,815 1,769
Interest expense, net 149 156 175
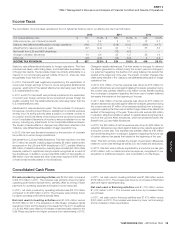
Income Before Income Taxes 2,145 1,659 1,594
Income tax provision 537 324 416
Net Income – including noncontrolling interest 1,608 1,335 1,178
Net Income – noncontrolling interest 11 16 20
NET INCOME – YUM! BRANDS, INC. $ 1,597 $ 1,319 $ 1,158
BASIC EARNINGS PER COMMON SHARE $ 3.46 $ 2.81 $ 2.44
DILUTED EARNINGS PER COMMON SHARE $ 3.38 $ 2.74 $ 2.38
DIVIDENDS DECLARED PER COMMON SHARE $ 1.24 $ 1.07 $ 0.92
See accompanying Notes to Consolidated Financial Statements.