Pizza Hut 2012 Annual Report Download - page 120
Download and view the complete annual report
Please find page 120 of the 2012 Pizza Hut annual report below. You can navigate through the pages in the report by either clicking on the pages listed below, or by using the keyword search tool below to find specific information within the annual report.-
 1
1 -
2
-
3
-
4
-
5
-
6
-
7
-
8
-
9
-
10
-
11
-
12
-
13
-
14
-
15
-
16
-
17
-
18
-
19
-
20
-
21
-
22
-
23
-
24
-
25
-
26
-
27
-
28
-
29
-
30
-
31
-
32
-
33
-
34
-
35
-
36
-
37
-
38
-
39
-
40
-
41
-
42
-
43
-
44
-
45
-
46
-
47
-
48
-
49
-
50
-
51
-
52
-
53
-
54
-
55
-
56
-
57
-
58
-
59
-
60
-
61
-
62
-
63
-
64
-
65
-
66
-
67
-
68
-
69
-
70
-
71
-
72
-
73
-
74
-
75
-
76
-
77
-
78
-
79
-
80
-
81
-
82
-
83
-
84
-
85
-
86
-
87
-
88
-
89
-
90
-
91
-
92
-
93
-
94
-
95
-
96
-
97
-
98
-
99
-
100
-
101
-
102
-
103
-
104
-
105
-
106
-
107
-
108
-
109
-
 110
110 -
 111
111 -
 112
112 -
 113
113 -
 114
114 -
 115
115 -
 116
116 -
 117
117 -
 118
118 -
 119
119 -
 120
120 -
 121
121 -
 122
122 -
 123
123 -
 124
124 -
 125
125 -
 126
126 -
 127
127 -
 128
128 -
 129
129 -
 130
130 -
131
-
132
-
133
-
134
-
135
-
136
-
137
-
138
-
139
-
140
-
141
-
142
-
143
-
144
-
145
-
146
-
147
-
148
-
149
-
150
-
151
-
152
-
153
-
154
-
155
-
156
-
157
-
158
-
159
-
160
-
161
-
162
-
163
-
164
-
165
-
166
-
167
-
168
-
169
-
170
-
171
-
172
 |
 |

YUM! BRANDS, INC.-2012 Form10-K 28
Form 10-K
PART II
ITEM7Management’s Discussion and Analysis ofFinancial Condition and Results ofOperations
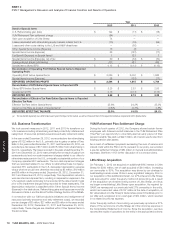
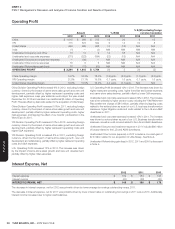
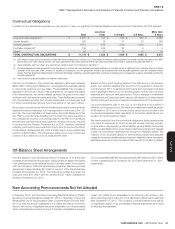
Operating Profi t
Amount % B/(W)
% B/(W) excluding foreign
currency translation
2012 2011 2010 2012 2011 2012 2011
China $ 1,015 $ 908 $ 755 12 20 9 15
YRI 715 673 592 6 14 10 8
United States 666 589 668 13 (12) N/A N/A
India (1) — (3) NM NM NM NM
Unallocated Occupancy and Other 16 14 9 14 58 N/A N/A
Unallocated and corporate expenses (271) (223) (194) (22) (15) N/A N/A
Unallocated Closures and impairment expense — (80) — NM NM N/A N/A
Unallocated Other income (expense) 76 6 5 NM NM N/A N/A
Unallocated Refranchising gain (loss) 78 (72) (63) NM NM N/A N/A
OPERATING PROFIT $ 2,294 $ 1,815 $ 1,769 26 3 26 (2)
China Operating margin 14.7% 16.3% 18.3% (1.6) ppts. (2.0) ppts. (1.7) ppts. (2.0) ppts.
YRI Operating margin 21.8% 21.1% 19.5% 0.7 ppts. 1.6 ppts. 0.7 ppts. 1.6 ppts.
United States Operating margin 19.9% 15.5% 16.2% 4.4 ppts. (0.7) ppts. N/A N/A
China Division Operating Profi t increased 9% in 2012, excluding foreign
currency, driven by the impact of same-store sales growth and new unit
development, partially offset by higher restaurant operating costs and
higher G&A expenses. Leap year added an extra day in the year ended
December29, 2012 and resulted in an additional $5million of Operating
Profi t. This was offset by deal costs related to the acquisition of Little Sheep.
China Division Operating Profi t increased 15% in 2011, excluding foreign
currency, driven by the impact of same-store sales growth and new unit
development, partially offset by higher restaurant operating costs, higher
G&A expenses, and lapping the effect of our brands’ participation in the
World Expo in 2010.
YRI Division Operating Profi t increased 10% in 2012, excluding foreign
currency, driven by the impact of same-store sales growth and new unit
development, partially offset by higher restaurant operating costs and
higher G&A expenses.
YRI Division Operating Profi t increased 8% in 2011, excluding foreign
currency, driven by the impact of same-store sales growth, new unit
development and refranchising, partially offset by higher restaurant operating
costs and G&A expenses.
U.S. Operating Profi t increased 13% in 2012. The increase was driven
by the impact of same-store sales growth and new unit development,
partially offset by higher G&A expenses.
U.S. Operating Profi t decreased 12% in 2011. The decrease was driven by
higher restaurant operating costs, higher franchise and license expenses
and same-store sales declines, partially offset by lower G&A expenses.
Unallocated and corporate expenses increased 22% in 2012. The increase
was driven primarily by higher pension costs, including the YUM Retirement
Plan settlement charge of $84million, partially offset by lapping costs
related to the actions taken as a part of our U.S. business transformation
measures, higher litigation costs and costs related to the LJS and A&W
divestitures in 2011.
Unallocated and corporate expenses increased 15% in 2011. The increase
was driven by actions taken as part of our U.S. Business transformation
measures, as well as costs incurred related to the LJS and A&W divestitures.
Unallocated Closures and impairment expense in 2011 includes $80million
of losses related to the LJS and A&W divestitures.
Unallocated Other income (expense) in 2012 includes a non-cash gain of
$74million related to our acquisition of Little Sheep. See Note4.
Unallocated Refranchising gain (loss) in 2012, 2011 and 2010 is discussed
in Note4.
Interest Expense, Net
2012 2011 2010
Interest expense $ 169 $ 184 $ 195
Interest income (20) (28) (20)
INTEREST EXPENSE, NET $ 149 $ 156 $ 175
The decrease in Interest expense, net for 2012 was primarily driven by lower average borrowings outstanding versus 2011.
The decrease in Interest expense, net for 2011 was primarily driven by lower interest rates on outstanding borrowings in 2011 versus 2010. Additionally,
interest income increased due to higher cash balances.