Pizza Hut 2012 Annual Report Download - page 133
Download and view the complete annual report
Please find page 133 of the 2012 Pizza Hut annual report below. You can navigate through the pages in the report by either clicking on the pages listed below, or by using the keyword search tool below to find specific information within the annual report.-
 1
1 -
2
-
3
-
4
-
5
-
6
-
7
-
8
-
9
-
10
-
11
-
12
-
13
-
14
-
15
-
16
-
17
-
18
-
19
-
20
-
21
-
22
-
23
-
24
-
25
-
26
-
27
-
28
-
29
-
30
-
31
-
32
-
33
-
34
-
35
-
36
-
37
-
38
-
39
-
40
-
41
-
42
-
43
-
44
-
45
-
46
-
47
-
48
-
49
-
50
-
51
-
52
-
53
-
54
-
55
-
56
-
57
-
58
-
59
-
60
-
61
-
62
-
63
-
64
-
65
-
66
-
67
-
68
-
69
-
70
-
71
-
72
-
73
-
74
-
75
-
76
-
77
-
78
-
79
-
80
-
81
-
82
-
83
-
84
-
85
-
86
-
87
-
88
-
89
-
90
-
91
-
92
-
93
-
94
-
95
-
96
-
97
-
98
-
99
-
100
-
101
-
102
-
103
-
104
-
105
-
106
-
107
-
108
-
109
-
110
-
111
-
112
-
113
-
114
-
115
-
116
-
117
-
118
-
119
-
120
-
121
-
122
-
 123
123 -
 124
124 -
 125
125 -
 126
126 -
 127
127 -
 128
128 -
 129
129 -
 130
130 -
 131
131 -
 132
132 -
 133
133 -
 134
134 -
 135
135 -
 136
136 -
 137
137 -
 138
138 -
 139
139 -
 140
140 -
 141
141 -
 142
142 -
 143
143 -
144
-
145
-
146
-
147
-
148
-
149
-
150
-
151
-
152
-
153
-
154
-
155
-
156
-
157
-
158
-
159
-
160
-
161
-
162
-
163
-
164
-
165
-
166
-
167
-
168
-
169
-
170
-
171
-
172
 |
 |

YUM! BRANDS, INC.-2012 Form10-K 41
Form 10-K
PART II
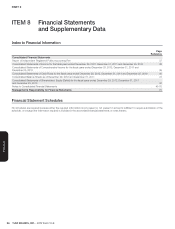
ITEM 8Financial Statements andSupplementaryData
Consolidated Balance Sheets
YUM! BRANDS, INC. AND SUBSIDIARIES
DECEMBER29, 2012 AND DECEMBER31, 2011
(in millions)
2012 2011
ASSETS
Current Assets
Cash and cash equivalents $ 776 $ 1,198
Accounts and notes receivable, net 301 286
Inventories 313 273
Prepaid expenses and other current assets 272 338
Deferred income taxes 111 112
Advertising cooperative assets, restricted 136 114
Total Current Assets 1,909 2,321
Property, plant and equipment, net 4,250 4,042
Goodwill 1,034 681
Intangible assets, net 690 299
Investments in unconsolidated affi liates 72 167
Restricted cash — 300
Other assets 575 475
Deferred income taxes 481 549
TOTAL ASSETS $ 9,011 $ 8,834
LIABILITIES AND SHAREHOLDERS’ EQUITY
Current Liabilities
Accounts payable and other current liabilities $ 1,945 $ 1,874
Income taxes payable 97 142
Short-term borrowings 10 320
Advertising cooperative liabilities 136 114
Total Current Liabilities 2,188 2,450
Long-term debt 2,932 2,997
Other liabilities and deferred credits 1,579 1,471
Total Liabilities 6,699 6,918
Redeemable noncontrolling interest 59 —
Shareholders’ Equity
Common Stock, no par value, 750 shares authorized; 451 shares and 460 shares issued in 2012 and 2011,
respectively — 18
Retained earnings 2,286 2,052
Accumulated other comprehensive income (loss) (132) (247)
Total Shareholders’ Equity – YUM! Brands, Inc. 2,154 1,823
Noncontrolling interests 99 93
Total Shareholders’ Equity 2,253 1,916
TOTAL LIABILITIES, REDEEMABLE NONCONTROLLING INTEREST AND SHAREHOLDERS’ EQUITY $ 9,011 $ 8,834
See accompanying Notes to Consolidated Financial Statements.