Pizza Hut 2012 Annual Report Download - page 156
Download and view the complete annual report
Please find page 156 of the 2012 Pizza Hut annual report below. You can navigate through the pages in the report by either clicking on the pages listed below, or by using the keyword search tool below to find specific information within the annual report.-
 1
1 -
2
-
3
-
4
-
5
-
6
-
7
-
8
-
9
-
10
-
11
-
12
-
13
-
14
-
15
-
16
-
17
-
18
-
19
-
20
-
21
-
22
-
23
-
24
-
25
-
26
-
27
-
28
-
29
-
30
-
31
-
32
-
33
-
34
-
35
-
36
-
37
-
38
-
39
-
40
-
41
-
42
-
43
-
44
-
45
-
46
-
47
-
48
-
49
-
50
-
51
-
52
-
53
-
54
-
55
-
56
-
57
-
58
-
59
-
60
-
61
-
62
-
63
-
64
-
65
-
66
-
67
-
68
-
69
-
70
-
71
-
72
-
73
-
74
-
75
-
76
-
77
-
78
-
79
-
80
-
81
-
82
-
83
-
84
-
85
-
86
-
87
-
88
-
89
-
90
-
91
-
92
-
93
-
94
-
95
-
96
-
97
-
98
-
99
-
100
-
101
-
102
-
103
-
104
-
105
-
106
-
107
-
108
-
109
-
110
-
111
-
112
-
113
-
114
-
115
-
116
-
117
-
118
-
119
-
120
-
121
-
122
-
123
-
124
-
125
-
126
-
127
-
128
-
129
-
130
-
131
-
132
-
133
-
134
-
135
-
136
-
137
-
138
-
139
-
140
-
141
-
142
-
143
-
144
-
145
-
 146
146 -
 147
147 -
 148
148 -
 149
149 -
 150
150 -
 151
151 -
 152
152 -
 153
153 -
 154
154 -
 155
155 -
 156
156 -
 157
157 -
 158
158 -
 159
159 -
 160
160 -
 161
161 -
 162
162 -
 163
163 -
 164
164 -
 165
165 -
 166
166 -
167
-
168
-
169
-
170
-
171
-
172
 |
 |

YUM! BRANDS, INC.-2012 Form10-K 64
Form 10-K
PART II
ITEM 8Financial Statements andSupplementaryData
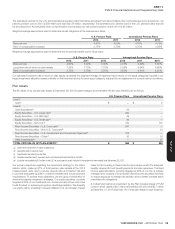
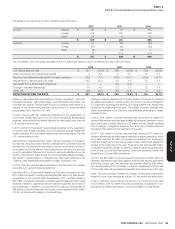
The details of 2012 and 2011 deferred tax assets (liabilities) are set forth below:
2012 2011
Operating losses and tax credit carryforwards $ 495 $ 592
Employee benefi ts 251 260
Share-based compensation 108 106
Self-insured casualty claims 50 47
Lease-related liabilities 115 134
Various liabilities 82 75
Property, plant and equipment 39 55
Deferred income and other 57 35
Gross deferred tax assets 1,197 1,304
Deferred tax asset valuation allowances (358) (368)
Net deferred tax assets $ 839 $ 936
Intangible assets, including goodwill $ (256) $ (167)
Property, plant and equipment (95) (121)
Other (48) (48)
Gross deferred tax liabilities $ (399) $ (336)
NET DEFERRED TAX ASSETS (LIABILITIES) $ 440 $ 600
Reported in Consolidated Balance Sheets as:
Deferred income taxes – current $ 111 $ 112
Deferred income taxes – long-term 481 549
Accounts payable and other current liabilities (5) (16)
Other liabilities and deferred credits (147) (45)
$ 440 $ 600
We have investments in foreign subsidiaries where the carrying values for
fi nancial reporting exceed the tax basis.We have not provided deferred
tax on the portion of the excess that we believe is essentially permanent
in duration.This amount may become taxable upon an actual or deemed
repatriation of assets from the subsidiaries or a sale or liquidation of
the subsidiaries.We estimate that our total temporary difference upon
which we have not provided deferred tax is approximately $2.6billionat
December29, 2012.A determination of the deferred tax liability on this
amount is not practicable.
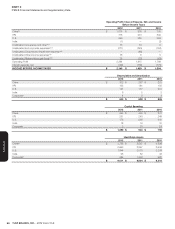
At December29, 2012, the Company has foreign operating and capital loss
carryforwards of $1.0billion and U.S. state operating loss, capital loss and
tax credit carryforwards of $1.0billion and U.S. federal capital loss and tax
credit carryforwards of $0.2billion.These losses are being carried forward in
jurisdictions where we are permitted to use tax losses from prior periods to
reduce future taxable income and will expire as follows:
Year of Expiration
Total2013 2014-2017 2018-2032 Indefi nitely
Foreign $ 21 $ 66 $ 121 $ 836 $ 1,044
U.S. state 20 128 848 5 1,001
U.S. federal — 107 103 — 210
$ 41 $ 301 $ 1,072 $ 841 $ 2,255
We recognize the benefi t of positions taken or expected to be taken in
tax returns in the fi nancial statements when it is more likely than not that
the position would be sustained upon examination by tax authorities.A
recognized tax position is measured at the largest amount of benefi t that
is greater than fi ftypercent likely of being realized upon settlement.
The Company had $309million and $348million of unrecognized tax benefi ts
at December29, 2012 and December31, 2011, respectively, $184million
and $197million of which, if recognized, would impact the effective income
tax rate.A reconciliation of the beginning and ending amount of unrecognized
tax benefi ts follows:
2012 2011
Beginning of Year $ 348 $ 308
Additions on tax positions - current year 50 85
Additions for tax positions - prior years 23 38
Reductions for tax positions - prior years (90) (58)
Reductions for settlements (6) (8)
Reductions due to statute expiration (16) (22)
Foreign currency translation adjustment — 5
END OF YEAR $ 309 $ 348
The Company believes it is reasonably possible its unrecognized tax benefi ts may decrease by approximately $43million in the next twelve months,
including approximately $28million which, if recognized upon audit settlement or statute expiration, would affect the 2013 effective tax rate. Each of
these positions is individually insignifi cant.