Pizza Hut 2012 Annual Report Download - page 148
Download and view the complete annual report
Please find page 148 of the 2012 Pizza Hut annual report below. You can navigate through the pages in the report by either clicking on the pages listed below, or by using the keyword search tool below to find specific information within the annual report.-
 1
1 -
2
-
3
-
4
-
5
-
6
-
7
-
8
-
9
-
10
-
11
-
12
-
13
-
14
-
15
-
16
-
17
-
18
-
19
-
20
-
21
-
22
-
23
-
24
-
25
-
26
-
27
-
28
-
29
-
30
-
31
-
32
-
33
-
34
-
35
-
36
-
37
-
38
-
39
-
40
-
41
-
42
-
43
-
44
-
45
-
46
-
47
-
48
-
49
-
50
-
51
-
52
-
53
-
54
-
55
-
56
-
57
-
58
-
59
-
60
-
61
-
62
-
63
-
64
-
65
-
66
-
67
-
68
-
69
-
70
-
71
-
72
-
73
-
74
-
75
-
76
-
77
-
78
-
79
-
80
-
81
-
82
-
83
-
84
-
85
-
86
-
87
-
88
-
89
-
90
-
91
-
92
-
93
-
94
-
95
-
96
-
97
-
98
-
99
-
100
-
101
-
102
-
103
-
104
-
105
-
106
-
107
-
108
-
109
-
110
-
111
-
112
-
113
-
114
-
115
-
116
-
117
-
118
-
119
-
120
-
121
-
122
-
123
-
124
-
125
-
126
-
127
-
128
-
129
-
130
-
131
-
132
-
133
-
134
-
135
-
136
-
137
-
 138
138 -
 139
139 -
 140
140 -
 141
141 -
 142
142 -
 143
143 -
 144
144 -
 145
145 -
 146
146 -
 147
147 -
 148
148 -
 149
149 -
 150
150 -
 151
151 -
 152
152 -
 153
153 -
 154
154 -
 155
155 -
 156
156 -
 157
157 -
 158
158 -
159
-
160
-
161
-
162
-
163
-
164
-
165
-
166
-
167
-
168
-
169
-
170
-
171
-
172
 |
 |

YUM! BRANDS, INC.-2012 Form10-K 56
Form 10-K
PART II
ITEM 8Financial Statements andSupplementaryData
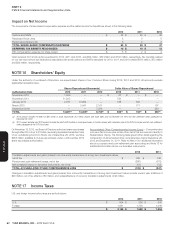
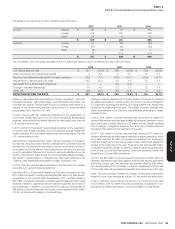
NOTE13 Fair Value Disclosures
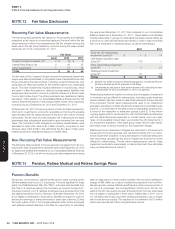
Recurring Fair Value Measurements
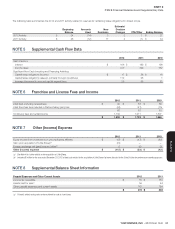
The following table presents fair values for those assets and liabilities
measured at fair value on a recurring basis and the level within the fair
value hierarchy in which the measurements fall.No transfers among the
levels within the fair value hierarchy occurred during the years ended
December29, 2012 or December31, 2011.
Fair Value
Level 2012 2011
Foreign Currency Forwards, net 2 $ (5) $ 2
Interest Rate Swaps, net 2 24 32
Other Investments 1 17 15
TOTAL $ 36 $ 49
The fair value of the Company’s foreign currency forwards and interest rate
swaps were determined based on the present value of expected future cash
fl ows considering the risks involved, including nonperformance risk, and
using discount rates appropriate for the duration based upon observable
inputs.The other investments include investments in mutual funds, which
are used to offset fl uctuations in deferred compensation liabilities that
employees have chosen to invest in phantom shares of a Stock Index
Fund or Bond Index Fund.The other investments are classifi ed as trading
securities in Other assets in our Consolidated Balance Sheets and their fair
value is determined based on the closing market prices of the respective
mutual funds as of December29, 2012 and December31, 2011.
At December29, 2012 the carrying values of cash and cash equivalents,
short-term investments, accounts receivable and accounts payable
approximated their fair values because of the short-term nature of these
instruments.The fair value of notes receivable net of allowances and lease
guarantees less subsequent amortization approximates their carrying
value.The Company’s debt obligations, excluding capital leases, were
estimated to have a fair value of $3.3billion (Level 2), compared to their
carrying value of $2.8billion.We estimated the fair value of debt using
market quotes and calculations based on market rates.
Non-Recurring Fair Value Measurements
The following table presents (income) expense recognized from all non-
recurring fair value measurements during the year ended December29, 2012
for assets and liabilities that remained on our Consolidated Balance Sheet as
of December29, 2012 or for all non-recurring fair value measurements during
the year ended December31, 2011 that remained on our Consolidated
Balance Sheet as of December31, 2011. These assets and liabilities
include restaurants or groups of restaurants that were impaired either as
a result of our semi-annual impairment review or when it was more likely
than not a restaurant or restaurant group would be refranchised.
2012 2011
Pizza Hut UK refranchising
impairment (Level 3)(a) $— $74
Little Sheep acquisition gain
(Level 2)(a) (74) —
Other refranchising impairment
(Level 3)(b) 4 21
Restaurant-level impairment
(Level 3)(b) 16 33
TOTAL $ (54) $ 128
(a) See Note4 for further discussions of Refranchising (gain) loss, including the Pizza Hut
UK dine-in refranchising and the acquisition of Little Sheep.
(b) The remaining net book value of these assets measured at fair value during the years
ended December29, 2012 and December31, 2011 is not significant.
Refranchising impairment results from writing down the assets of restaurants
or restaurant groups offered for refranchising, including certain instances
where a decision has been made to refranchise restaurants that are deemed
to be impaired. The fair value measurements used in our impairment
evaluation are based on either actual bids received from potential buyers
(Level 2), or on estimates of the sales prices we anticipated receiving from
a buyer for the restaurant or restaurant groups (Level 3). To the extent
ongoing agreements to be entered into with the franchisee simultaneous
with the refranchising are expected to contain terms, such as royalty
rates, not at prevailing market rates, we consider the off-market terms in
our impairment evaluation.If the asset group meets held-for-sale criteria,
estimated costs to sell are included in the impairment charge.
Restaurant-level impairment charges are recorded in Closures and
impairment (income) expenses and resulted primarily from our semi-
annual impairment evaluation of long-lived assets of individual restaurants
that were being operated at the time of impairment and had not been
offered for refranchising. The fair value measurements used in these
impairment evaluations were based on discounted cash fl ow estimates
using unobservable inputs (Level 3).
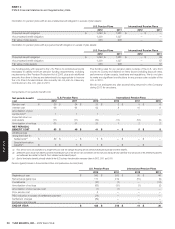
NOTE14 Pension, Retiree Medical and Retiree Savings Plans
Pension Benefi ts
We sponsor noncontributory defi ned benefi t pension plans covering certain
full-time salaried and hourly U.S. employees.The most signifi cant of these
plans, the YUM Retirement Plan (the “Plan”), is funded while benefi ts from
the other U.S. plans are paid by the Company as incurred.During 2001,
the plans covering our U.S. salaried employees were amended such that
any salaried employee hired or rehired by YUM after September30, 2001
is not eligible to participate in those plans.Benefi ts are based on years of
service and earnings or stated amounts for each year of service.During
the fourth quarter of 2012, the Company allowed certain former employees
with deferred vested balances in the Plan an opportunity to voluntarily
elect an early payout of their pension benefi ts. We recorded a settlement
charge of $84million as a result of settlement payments from the Plan.
We also sponsor various defi ned benefi t pension plans covering certain of
our non-U.S. employees, the most signifi cant of which are in the UK.Our
plans in the UK have previously been amended such that new employees
are not eligible to participate in these plans. Additionally, in 2011 one of
our UK plans was frozen such that existing participants can no longer
earn future service credits. This resulted in a curtailment of $10million
which was recorded as Other comprehensive income.