Pizza Hut 2012 Annual Report Download - page 119
Download and view the complete annual report
Please find page 119 of the 2012 Pizza Hut annual report below. You can navigate through the pages in the report by either clicking on the pages listed below, or by using the keyword search tool below to find specific information within the annual report.-
 1
1 -
2
-
3
-
4
-
5
-
6
-
7
-
8
-
9
-
10
-
11
-
12
-
13
-
14
-
15
-
16
-
17
-
18
-
19
-
20
-
21
-
22
-
23
-
24
-
25
-
26
-
27
-
28
-
29
-
30
-
31
-
32
-
33
-
34
-
35
-
36
-
37
-
38
-
39
-
40
-
41
-
42
-
43
-
44
-
45
-
46
-
47
-
48
-
49
-
50
-
51
-
52
-
53
-
54
-
55
-
56
-
57
-
58
-
59
-
60
-
61
-
62
-
63
-
64
-
65
-
66
-
67
-
68
-
69
-
70
-
71
-
72
-
73
-
74
-
75
-
76
-
77
-
78
-
79
-
80
-
81
-
82
-
83
-
84
-
85
-
86
-
87
-
88
-
89
-
90
-
91
-
92
-
93
-
94
-
95
-
96
-
97
-
98
-
99
-
100
-
101
-
102
-
103
-
104
-
105
-
106
-
107
-
108
-
 109
109 -
 110
110 -
 111
111 -
 112
112 -
 113
113 -
 114
114 -
 115
115 -
 116
116 -
 117
117 -
 118
118 -
 119
119 -
 120
120 -
 121
121 -
 122
122 -
 123
123 -
 124
124 -
 125
125 -
 126
126 -
 127
127 -
 128
128 -
 129
129 -
130
-
131
-
132
-
133
-
134
-
135
-
136
-
137
-
138
-
139
-
140
-
141
-
142
-
143
-
144
-
145
-
146
-
147
-
148
-
149
-
150
-
151
-
152
-
153
-
154
-
155
-
156
-
157
-
158
-
159
-
160
-
161
-
162
-
163
-
164
-
165
-
166
-
167
-
168
-
169
-
170
-
171
-
172
 |
 |

YUM! BRANDS, INC.-2012 Form10-K 27
Form 10-K
PART II
ITEM7Management’s Discussion and Analysis ofFinancial Condition and Results ofOperations
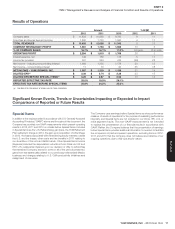
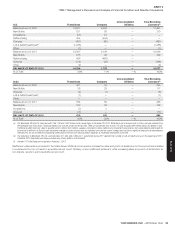
The increase in YRI G&A expenses for 2011 was driven by increased
investment in strategic growth markets, including the acquisition of our
Russia business in 2010, partially offset by G&A savings from refranchising
all of our remaining company restaurants in Mexico.
The increase in U.S. G&A expenses for 2012 was driven by higher pension
costs, incentive compensation costs and litigation costs, partially offset by
the LJS and A&W divestitures and our restaurant refranchising initiatives.
The decrease in U.S. G&A expenses for 2011 was driven by lapping of higher
litigation and incentive compensation costs in 2010 and G&A savings from
the actions taken as part of our U.S. business transformation measures.
The increase in Unallocated G&A expenses for 2012 was driven primarily
by higher pension costs, including the YUM Retirement Plan settlement
charge of $84million, partially offset by lapping costs related to the actions
taken as part of our U.S. business transformation measures, lower litigation
costs and costs related to the LJS and A&W divestitures in 2011.
The increase in Unallocated G&A expenses for 2011 was driven primarily
by actions taken as part of our U.S. business transformation measures
and costs related to the LJS and A&W divestitures.
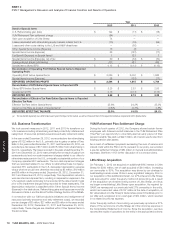
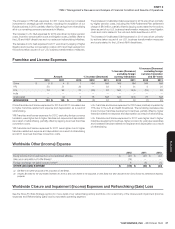
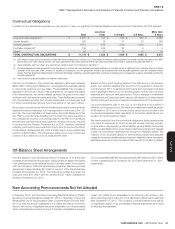
Franchise and License Expenses
Amount % Increase (Decrease)
% Increase (Decrease)
excluding foreign
currency translation
% Increase (Decrease)
excluding foreign
currency translation
and 53rd week
2012 2011 2010 2012 2011 2012 2011 2012 2011
China $ 9 $ 4 $ 1 NM NM NM NM NM NM
YRI 50 51 36 — 39 4 31 4 30
U.S. 74 92 70 (20) 32 N/A N/A (19) 32
India — — — — — — — — —
Unallocated — (2) 3 78 NM N/A N/A 78 NM
WORLDWIDE $ 133 $ 145 $ 110 (8) 32 (7) 30 (7) 29
China Franchise and license expenses for 2012 and 2011 increased due
to higher franchise-related rent expense and depreciation as a result of
refranchising.
YRI Franchise and license expenses for 2012, excluding foreign currency
translation, were higher due to higher franchise rent expense and depreciation
as a result of refranchising, partially offset by lapping bi-annual franchise
convention costs.
YRI Franchise and license expenses for 2011 were higher due to higher
franchise-related rent expense and depreciation as a result of refranchising
and 2011 bi-annual franchise convention costs.
U.S. Franchise and license expenses for 2012 were positively impacted by
15% due to the LJS and A&W divestitures. The remaining decrease was
driven by lower franchise development incentives, partially offset by higher
franchise-related rent expense and depreciation as a result of refranchising.
U.S. Franchise and license expenses for 2011 were higher due to higher
franchise development incentives, higher provision for past-due receivables
and increased franchise-related rent expense and depreciation as a result
of refranchising.
Worldwide Other (Income) Expense
2012 2011 2010
Equity income from investments in unconsolidated affi liates $ (47) $ (47) $ (42)
Gain upon acquisition of Little Sheep(a) (74) — —
Foreign exchange net (gain) loss and other(b) 6 (6) (1)
OTHER (INCOME) EXPENSE $ (115) $ (53) $ (43)
(a) See Note4 for further discussion of the acquisition of Little Sheep.
(b) Includes $6million for the year ended December29, 2012 of deal costs related to the acquisition of Little Sheep that were allocated to the China Division for performance reporting
purposes.
Worldwide Closure and Impairment (Income) Expenses and Refranchising (Gain) Loss
See the Store Portfolio Strategy section for more detail of our refranchising activity and Note4 for a summary of the Closure and impairment (income)
expenses and Refranchising (gain) loss by reportable operating segment.