Pizza Hut 2012 Annual Report Download - page 49
Download and view the complete annual report
Please find page 49 of the 2012 Pizza Hut annual report below. You can navigate through the pages in the report by either clicking on the pages listed below, or by using the keyword search tool below to find specific information within the annual report.-
 1
1 -
2
-
3
-
4
-
5
-
6
-
7
-
8
-
9
-
10
-
11
-
12
-
13
-
14
-
15
-
16
-
17
-
18
-
19
-
20
-
21
-
22
-
23
-
24
-
25
-
26
-
27
-
28
-
29
-
30
-
31
-
32
-
33
-
34
-
35
-
36
-
37
-
38
-
 39
39 -
 40
40 -
 41
41 -
 42
42 -
 43
43 -
 44
44 -
 45
45 -
 46
46 -
 47
47 -
 48
48 -
 49
49 -
 50
50 -
 51
51 -
 52
52 -
 53
53 -
 54
54 -
 55
55 -
 56
56 -
 57
57 -
 58
58 -
 59
59 -
60
-
61
-
62
-
63
-
64
-
65
-
66
-
67
-
68
-
69
-
70
-
71
-
72
-
73
-
74
-
75
-
76
-
77
-
78
-
79
-
80
-
81
-
82
-
83
-
84
-
85
-
86
-
87
-
88
-
89
-
90
-
91
-
92
-
93
-
94
-
95
-
96
-
97
-
98
-
99
-
100
-
101
-
102
-
103
-
104
-
105
-
106
-
107
-
108
-
109
-
110
-
111
-
112
-
113
-
114
-
115
-
116
-
117
-
118
-
119
-
120
-
121
-
122
-
123
-
124
-
125
-
126
-
127
-
128
-
129
-
130
-
131
-
132
-
133
-
134
-
135
-
136
-
137
-
138
-
139
-
140
-
141
-
142
-
143
-
144
-
145
-
146
-
147
-
148
-
149
-
150
-
151
-
152
-
153
-
154
-
155
-
156
-
157
-
158
-
159
-
160
-
161
-
162
-
163
-
164
-
165
-
166
-
167
-
168
-
169
-
170
-
171
-
172
 |
 |

YUM! BRANDS, INC.-2013Proxy Statement 31
Proxy Statement
EXECUTIVE COMPENSATION
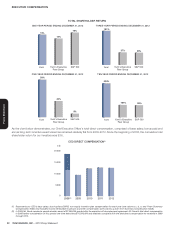
The success of our strategy is evidenced by our consistent year-over-year EPS growth and the related increase in our stock price and
Total Shareholder Return (“TSR”) over the past ten years.
EARNINGS PER SHARE* - TEN YEAR GROWTH
2002 2003 2004 2005 2006 2007 2008 2009 2010 2011
$10.43
$66.06
+534% Total
Shareholder
Return
2012
13% 13%
15%
13%
14%
15%
14%
13%
17%
14%
13%
*For purposes of calculating the year-over-year growth in EPS in the chart above, EPS excludes special items believed to be distortive of consolidated results on a
year-over-year basis and the initial impact of expensing stock options in 2005. The special items excluded are the same as those excluded in the Company’s annual
earnings releases. EPS growth is calculated based on YUM ’s fi scal year end which ends the last Saturday of each calendar year. The total shareholder return refl ects
a calendar year end of December 31, 20 12.
In addition to EPS growth, our strategy’s success is demonstrated by our one-, three-, fi ve- and ten-year results for TSR as compared
to our executive compensation peer group (“Executive Peer Group”) and the S&P 500. Consistently strong total shareholder return,
especially over the long term, means not only are we creating value for shareholders but our superior relative results suggests we are
exceeding shareholder expectations compared to the market generally.